[Special Contribution] “Tourism × Carbon Neutrality” — The Challenges Facing the Tourism Sector —

The Glasgow Declaration, announced at COP26 in 2021, sets a goal of halving carbon dioxide (CO2) emissions from the tourism sector over the next 10 years and achieving net-zero emissions by 2050.What scenarios exist in Japan for achieving these goals over the next decade? As an expert in transportation studies who has long been concerned with strategies to reduce greenhouse gas emissions—including CO2—from the tourism sector, the author analyzes the structure of CO2 emissions in the tourism sector based on data and examines the challenges that need to be addressed.
1. The Storm Called “Carbon Neutrality”—The Impact of the Glasgow Declaration
The issue of so-called global warming began with the United Nations Conference on Environment and Development (Earth Summit) in 1992, which led to the establishment of the Conference of the Parties (COP) to the United Nations Framework Convention on Climate Change. To date, 26 conferences have been held, during which the issue has been discussed.Several of these sessions have served as landmark meetings that established frameworks for international cooperation aimed at reducing greenhouse gas emissions. Notable examples include COP3 (1997), where the “Kyoto Protocol”—which set legally binding emission reduction targets for developed nations—was adopted,and COP21 (2015), where the “Paris Agreement”—the successor to the Kyoto Protocol and a framework for emissions reductions by all countries from 2020 onward—was agreed upon.
The tourism sector must pay close attention to COP26 in 2021.This is because the “Glasgow Declaration – Climate Action in Tourism”*1 was announced at that conference, setting an ambitious goal to commit to strong action to halve carbon dioxide emissions in the tourism sector over the next 10 years and achieve net-zero emissions by 2050.In recent years, the tourism industry has also been called upon to pursue “sustainable tourism development,” and travelers’ environmental awareness—both domestically and internationally—has risen significantly.Furthermore, originating in Sweden, the concept of “flight shame”—the idea that air travel for tourism should be avoided as much as possible—has even emerged. Against this backdrop, it seems the Glasgow Declaration has been received very favorably by the public.
However, as someone who specializes in transportation studies and holds a Ph.D. in engineering, when I first heard about the Glasgow Declaration, I wondered if some groundbreaking new mobility or energy technology might have emerged.Setting aside the goal of “net-zero emissions by 2050,” I found it extremely difficult to imagine achieving a “50% reduction in emissions over the next 10 years” based on current technology, and I couldn’t help but groan.It appears that France and Spain are leading the Glasgow Declaration, but according to the Agency for Natural Resources and Energy’s Annual Report*2, France can cover 90 percent of its electricity mix with nuclear and renewable energy, and Spain can cover 60 percent, making it more feasible for them. My honest reaction was, “That’s unfair. They’ve got us!”
So, what should Japan’s tourism sector do? I am currently affiliated with a higher education institution that describes itself as “the science of tourism.” Since taking up my post in FY 2011, I have been deeply concerned about strategies to reduce greenhouse gas emissions—particularly carbon dioxide—generated by the tourism sector, and I have been raising these issues with my students in my tourism planning courses.Taking this post as an opportunity, I’d like to reorganize my own thoughts and reconsider what we can do.
2. Analyzing Energy Use in Japan’s Tourism Sector
Since national industry-related statistics do not classify tourism as a separate sector, statistical values such as production value, energy consumption, and carbon dioxide emissions must be calculated by accounting for tourism’s contribution to each sector and then aggregating the totals.For example, Shimizu and In*3 used input-output tables, greenhouse gas emission intensity (per unit of production value), and the Tourism Consumption Statistics Survey to estimate carbon dioxide emissions from the tourism industries in Japan and South Korea as of 2010.Their findings show that carbon dioxide emissions from Japan’s tourism sector accounted for 5.64% of total industrial emissions—twice as much as its 2.88% share of production value—and that within the tourism sector, the transportation sector’s contribution is relatively high. It is believed that this pattern has not changed significantly as of 2022.
Here, we would like to provide an overview of Japan’s energy usage based on the aforementioned annual report by the Agency for Natural Resources and Energy. Regarding primary energy supply, the level in FY 2020 stood at approximately 78% of the peak reached in FY 2004, indicating a steady downward trend.Of this total, fossil fuel sources—including oil, coal, and natural gas—account for about 74%. Nuclear power, which accounted for more than 10% prior to the Great East Japan Earthquake, now stands at 1.8%, while renewable energy (excluding hydropower) accounts for less than 10%, presenting a picture that is entirely different from that of France and Spain mentioned earlier.Under current conditions, it is unlikely that the share of renewable energy will expand significantly in the short term, meaning that increased energy consumption will almost directly lead to an increase in carbon dioxide emissions.Sixty-seven percent of primary energy supply is used for final energy consumption, with 45.6% of final energy consumption accounted for by the industrial sector (primary and secondary industries), 22.3% by the transportation sector, and 16.3% by the commercial and other sectors (tertiary industries, excluding transportation and energy conversion).As a long-term trend since the first oil crisis, the industrial sector’s share has declined due to factors such as improved energy efficiency and changes in industrial structure, while the shares of the transportation sector—which is closely linked to tourism—and the commercial and other sectors have increased.
Compared to the “Other Services” sector—which includes hotels, inns, and restaurants, where energy efficiency can be achieved through measures such as centralizing energy supply—the transportation sector requires improvements in the energy efficiency of individual vehicles, making it relatively difficult to achieve significant reductions in energy consumption. Therefore, it is important to examine the current situation in the transportation sector.As of FY 2020, 43.6% of the transportation sector’s final energy consumption was attributable to the passenger transport segment, of which private passenger cars accounted for 83.7%. Regarding energy sources in the passenger transport segment, 79.2% was gasoline and 7.4% was diesel fuel, indicating that fossil-based energy sources continue to account for an overwhelming share.
3. Overview of Recent Domestic Tourism Flows
The “National Survey on Net Passenger Flow on Major Routes”*4, conducted every five years by the Ministry of Land, Infrastructure, Transport and Tourism, publishes aggregated data on the origins and destinations of inter-city travel across prefectural boundaries, as well as the modes of transportation and purposes of travel.The most recent results currently available are from FY 2015. Although the characteristics of inter-city travel are believed to have changed significantly due to the impact of the COVID-19 pandemic, we consider these data to be a valuable reference when looking ahead to 2025 and beyond, when travel patterns may return to a state somewhat closer to pre-pandemic levels.
Passenger flow in FY 2015 totaled approximately 1.8 billion people, representing a 10% increase from FY 2010. Of this total, passenger cars and similar vehicles accounted for approximately 1.34 billion people (about 75%), while rail accounted for 17.3% and air travel for 5.0%.Travel for tourism purposes accounted for 32.3% of weekday trips and 52.5% of weekend trips (weddings, funerals, and visits to relatives are classified as personal travel and are not included in the tourism category), indicating that tourism plays a significant role in long-distance domestic travel.
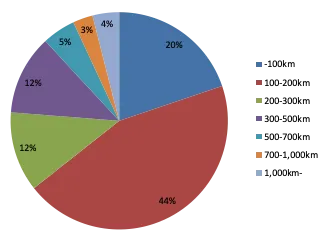
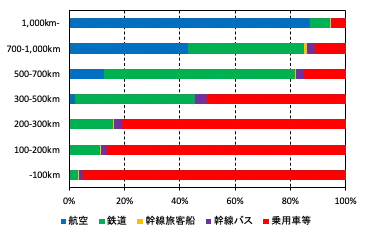
Regarding passenger traffic by distance range between origin and destination, 44% fall within the 100–200 km range and 20% within the under-100 km range, indicating that short-distance travel dominates (Figure 1).Regarding the mode share by distance range, the share of passenger cars and similar vehicles is larger for shorter distances; for trips under 200 km, approximately 90% are made by passenger cars and similar vehicles, and for tourism-related travel on holidays, 84.7% are made by passenger cars and similar vehicles (Figure 2). This highlights the prominent role of passenger cars and similar vehicles in inter-city travel.
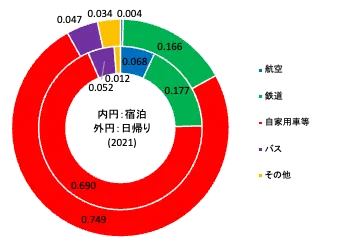
According to the “Survey on Travel and Tourism Consumption Trends”*5 conducted by the Japan Tourism Agency, while the share of private cars and similar vehicles for tourism and recreational travel had been on a downward trend prior to the COVID-19 pandemic, it has shown a resurgence since then.In 2021, 75% of day trips and 69% of overnight trips were made by private cars and similar vehicles (Figure 3). As with the aforementioned National Survey on Net Passenger Flow on Major Routes, this demonstrates that automobile use is dominant in domestic travel for tourism purposes.
Regarding the use of domestic trunk transportation by inbound tourists, the aforementioned “National Trunk Passenger Net Flow Survey” reported data for routes between Tokyo and the Chukyo, Kinki, Hiroshima, and Fukuoka regions—where rail, express buses, and air travel are available—and it is notable that the share of (inexpensive) express buses is higher compared to that of Japanese travelers.It is possible that this is influenced by the fact that the “Nozomi” bullet trains cannot be used with the Japan Rail Pass for inbound tourists.
4. Understanding Carbon Dioxide Emissions by Mode of Transportation
According to a report*6 by the Ministry of Land, Infrastructure, Transport and Tourism, carbon dioxide emissions per passenger-kilometer (emission factor) by mode of transportation in FY 2020 were 28 g/passenger-kilometer for rail, compared to 109 g/passenger-kilometer for buses, 133 g/passenger-kilometer for air travel, andprivate passenger cars at 131 g/passenger-kilometer (Figure 4).In FY 2020, the number of passengers per service was low due to the impact of the COVID-19 pandemic, resulting in a significant deterioration in emissions for rail, bus, and air travel compared to FY 2019. However, if transportation demand returns to pre-pandemic levels in the future, it is reasonable to assume that future emission factors will be equivalent to those of FY 2019.Furthermore, considering that private passenger cars emitted 169 g/passenger-kilometer in FY 2010, the effects of the widespread adoption of hybrid vehicles and the introduction of electric vehicles (albeit in small numbers) over the past decade appear to have been significant.According to the aforementioned National Survey of Net Passenger Flows on Trunk Routes, the average travel distance by mode of transportation in FY 2015 was 1,204 km for air travel, 362 km for rail,trunk-line buses at 265 km, and private passenger cars at 167 km. Assuming these figures remained unchanged in FY 2019, the estimated carbon dioxide emissions per trip are 118 kg for air travel, 6 kg for rail, 15 kg for buses, and 22 kg for private passenger cars.

5. What the Tourism Sector (Particularly the Passenger Transportation Sector) Should Consider Regarding Carbon Neutrality
Thus far, we have examined the status of energy use and CO₂ emissions in the tourism sector based on several surveys.In summary, since the use of private cars—which generate relatively high CO₂ emissions—dominates the transportation essential to tourism activities, the current structure is such that even if tourism destinations, such as lodging facilities, actively pursue a transition to renewable energy, these efforts could be undermined by emissions from transportation.As tourism in nearby suburban areas increases—as exemplified by “micro-tourism,” a buzzword during the COVID-19 pandemic—the use of private cars is likely to become even more prevalent. Furthermore, the emissions from international air travel have not actually been factored into the discussion above.Because international flights cover long distances, carbon dioxide emissions per trip approach one metric ton. As an island nation, Japan—with the exception of South Korea—relies on air travel for the vast majority of its inbound tourists; therefore, it bears significant responsibility for the unaccounted-for carbon dioxide emissions from international flights.
Regarding automotive technology, you are likely aware that research and development on electric vehicles is advancing worldwide. While it is true that they do not emit carbon dioxide while driving, the source of the energy used to charge them remains an issue.The Ministry of Economy, Trade and Industry’s Strategic Council for the New Era of Automobiles*7 indicates that, as of 2015, the carbon dioxide emission intensity per kilometer for gasoline-powered vehicles in Japan was 132 g/km, while that for hybrid vehicles had been significantly reduced to 69 g/km; however, the figure for electric vehicles was 59 g/km—not much different from that of hybrid vehicles.In contrast, France—benefiting from the widespread use of nuclear power and renewable energy—has achieved a figure of 5 g/km, which reaffirms the vital need to increase our use of renewable energy and nuclear power.
In the aviation sector, although efforts toward electrification have begun, it remains extremely unclear when they will be put into practical use. Consequently, the industry is gradually moving toward the introduction of a new fuel called Sustainable Aviation Fuel (SAF).SAF is a fuel derived from biomass, waste, or waste oil. Although its combustion emits carbon dioxide, if plants sequester this CO₂ for growth, it does not increase the amount of carbon in the atmosphere; therefore, it is considered more sustainable than jet fuel, which releases new carbon from underground into the atmosphere.Mr. Wolff, Head of the Mobility Sector at the World Economic Forum (WEF), referred to the European SAF deployment scenario discussed in the 2021 ICAO Stocktaking Pre-Stocktaking Webinar*8, Mr. Wolff, the World Economic Forum’s (WEF) Representative for the Mobility Industry, discussed a scenario for the adoption of Sustainable Aviation Fuel (SAF) in Europe, stating that SAF could account for 10% of all jet fuel by 2030 and 75% by 2050. However, this scenario relies heavily on production technologies still under development, and there is undeniably a degree of uncertainty regarding costs and the amount of energy required for production.In Japan as well, momentum is building among diverse stakeholders: domestically produced SAF was used on scheduled flights by JAL and ANA in 2021, and the two airlines collaborated to produce a joint report on SAF.Japan has also set a target of increasing the share of SAF to 10% by 2030, and the key challenge will be determining to what extent this can be met with domestically produced SAF while keeping costs down. Looking toward 2050, the critical factor will be when technology can be developed to efficiently produce SAF from the atmosphere—a resource with virtually unlimited reserves.
In light of the current situation facing Japan’s automotive and aviation sectors, it seems unlikely that a “best-case scenario”—in which the tourism sector’s CO₂ emissions are halved by 2030 solely through the adoption of electrification technologies—will be achievable.The most viable strategy is likely to ask local businesses—such as hotels, ryokans, and restaurants—to make further efforts to reduce emissions, while simultaneously reducing the volume of air and road travel (passenger-kilometers) as much as possible. Ultimately, the reality may be that businesses and travelers have no choice but to build upon the individual actions each can take.
What can be done by 2030 to reduce CO₂ emissions—even slightly—in the passenger transportation sector alone? As for air travel, aside from competing with the Shinkansen on routes between 500 and 700 km, it is difficult to shift passengers to other modes of transportation; as long as long-distance tourism travel is permitted at pre-COVID levels, we have no choice but to pin our hopes on the introduction of Sustainable Aviation Fuel (SAF).As for automobiles, reducing congestion on expressways would improve travel speeds and help curb carbon dioxide emissions, so we would like to see as many people as possible switch to rail or bus travel. On the other hand, the reality is that in many tourist destinations, the convenience of getting around the area is significantly reduced without a car. Therefore, while we must strive to establish bus services and shared shuttle services as the backbone of tourist mobility within these destinations, it is essential to vigorously promote a secondary and tertiary transportation service network—such as shared services for personal mobility devices, bicycles, andelectric kick scooters along these routes. Furthermore, by utilizing renewable energy generated in the vicinity of tourist destinations as the power source for these services, it may be possible to significantly reduce carbon dioxide emissions.However, it goes without saying that realizing such a scenario will entail significant costs (especially in the early stages), and we must avoid a situation where the burden on tourists and businesses exceeds acceptable limits. We hope to see policy proposals addressing this challenge, including the introduction of economic incentive programs by tourism authorities.
On the other hand, it seems that national and regional energy policies themselves will play a dominant role in achieving carbon neutrality by 2050, and there may not be much room for the tourism sector to take the initiative.However, while Japan possesses abundant forest resources that absorb carbon dioxide, according to the Forestry and Forest Products Research Institute*9, there appears to be an issue where absorption capacity decreases as trees age. Under conditions of inadequate forest management, this could become a major obstacle not only for the tourism sector but also for achieving net-zero emissions nationwide.Actively incorporating forest restoration activities as a form of ecotourism would be highly significant in helping to achieve carbon neutrality.
6. Conclusion
In this paper, I have analyzed the structure of carbon dioxide emissions in Japan’s tourism sector based on publicly available data and identified the challenges that the passenger transportation sector, in particular, must address by the target years of 2030 and 2050 for achieving carbon neutrality.While I am not entirely confident in the content discussed here, I feel that I have been able to present one of several conceivable scenarios. I hope to take advantage of this opportunity to write this article to connect with fellow researchers and practitioners with whom I can discuss this issue further.
(References: URLs as of July 10, 2022)
*1 Glasgow Declaration – Climate Action in Tourism
*2 Agency for Natural Resources and Energy: Annual Report on Energy for FY Reiwa 3
*3 Tetsuo Shimizu and Seong-hwan In (2015): Estimation of Carbon Dioxide Emissions from the Japanese and South Korean Tourism Industries: Prospects for Mitigation, Journal of Tourism Science, Vol. 8, pp. 71–79.
*4 Ministry of Land, Infrastructure, Transport and Tourism: 6th (FY2015) Survey on Net Passenger Flow on Major Routes, “The Actual State of Passenger Flow on Major Routes: Analysis of Data from the National Survey on Net Passenger Flow on Major Routes”
*5 Japan Tourism Agency: Survey on Travel and Tourism Consumption Trends
*6 Ministry of Land, Infrastructure, Transport and Tourism: Carbon Dioxide Emissions in the Transportation Sector
*7 Strategic Council for the New Era of the Automobile Industry (2018): Interim Report of the Strategic Council for the New Era of the Automobile Industry
8* Wolff, C. (2021): “Ramping up Sustainable Aviation Fuels,” presented at the ICAO Pre-Stocktaking Webinars
9* Forestry and Forest Products Research Institute: How to Measure Carbon Absorption by Forests
著者