Understanding Traveler Behavior Through the Use of People Flow Data

"People flow data" allows us to understand "what kind of" people are visiting, "when," "from where," "to where," and "how long" they stay. With the widespread adoption of smartphones and the increasing collection of highly accurate location data via apps, a wealth of precise people flow data has been accumulated. Driven by advancements in data processing and AI technology, as well as the COVID-19 pandemic—which has drawn attention to this data as an indicator of foot traffic and crowd levels in urban areas—various companies are now offering a range of analytical services and insights. In this column, I would like to examine traveler behavior using analysis tools that are accessible even without specialized knowledge of people flow data.
1. People flow data is a powerful tool for gaining a deeper understanding of travelers
For marketing professionals involved in tourism planning or businesses targeting travelers, people flow data serves as an extremely powerful analytical tool. In particular, data collected based on GPS location information provides a level of granularity that cannot be obtained through surveys or traffic surveys, thereby dramatically increasing the resolution of analysis.
A key benefit is that highly accurate data is collected in real time, which helps in understanding traveler behavior. In other words, it can be used as foundational information during the initial stages of hypothesis testing and strategy development. Additionally, by specifying specific dates and times, it facilitates comparative analysis with historical data—such as comparing the current year to the previous year, weekdays to weekends, or event periods to regular periods. In terms of data granularity and cost, it is possible to obtain far more detailed data at a lower cost than traffic surveys.
However, when conducting analyses, it is necessary to be mindful of the characteristics of the data source and the aggregation logic as prerequisites.
2. What Can Be Learned from People Flow Data
The insights that can be derived from people flow data vary depending on the type of data, the method of collection, and the aggregation method. In this analysis, we used data (*1) collected by mobile carriers based on smartphone GPS functions.
One of the primary analytical dimensions for people flow data is the time axis. By aggregating the number of people in the target area by day, day of the week, and time of day, and comparing figures such as day-over-day or year-over-year changes, as well as morning versus afternoon trends, you can visualize patterns in visitor fluctuations.
Next, other analytical dimensions that make it easy to grasp characteristics include gender, age, and place of residence. By understanding the number of visitors by age group, we can visualize characteristics related to the age of visitors, such as whether the target area attracts more young people or more seniors.Furthermore, for services utilizing data from mobile carriers, it is possible to estimate visitors, workers, and residents based on the number of days or hours spent in the area, enabling analysis by demographic attribute. However, caution is required when interpreting these results, as the data reflects the age groups of smartphone subscribers and may not include data on teenagers.
Furthermore, there is a type of people flow data called OD (Origin-Destination) data, which tracks the number of people moving between a specific origin and destination to illustrate the flow of people between two points. By utilizing this data, you can visualize where the majority of visitors to the target area reside. Additionally, by substituting the two points with tourist attractions, it is possible to visualize visitor circulation patterns.
Various analytical methods exist for analyzing people flow data. It is crucial to design the analysis based on the analysis objectives, as well as the granularity and characteristics of the data. For information on the types of people flow data, the benefits of utilizing it, selecting data and analysis tools, analysis methods, and use cases, please refer to the “Guide to the Utilization of People Flow Data for Solving Regional Issues,” published on March 31, 2022, by the Information Utilization Promotion Division of the Real Estate and Construction Economy Bureau at the Ministry of Land, Infrastructure, Transport and Tourism.
We also offer an analysis service that utilizes visitor flow data (separate from the analysis service used in this case) and employs statistical analysis, including behavior prediction based on our proprietary logic.
3. Specific Analysis Examples
(1) Case Study: New Year’s Visitors to Meiji Shrine
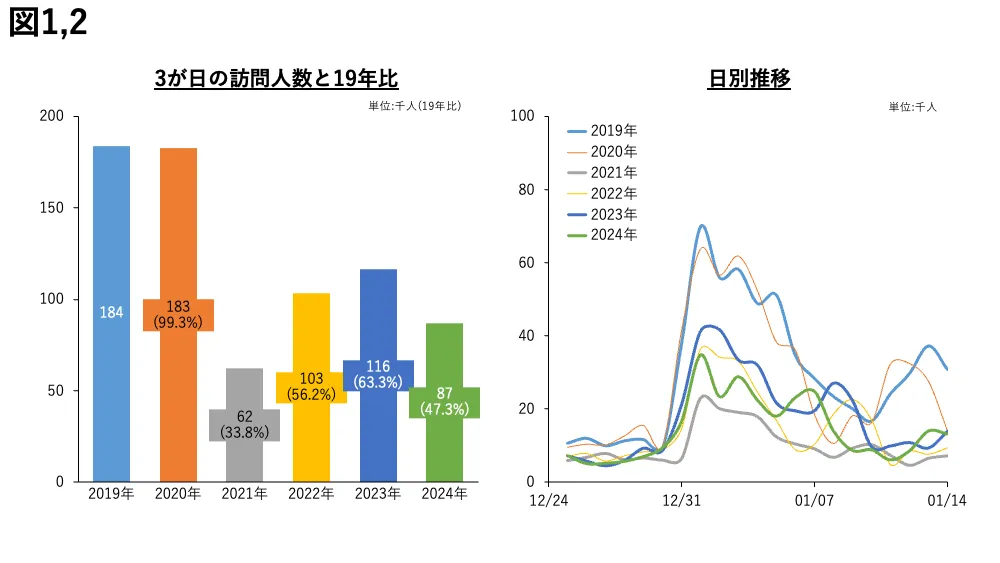
Over the past six years, the number of first-day-of-the-year visitors to Meiji Shrine was highest in 2019 and lowest in 2021, which marked the first New Year’s holiday following the COVID-19 pandemic. Although visitor numbers had been increasing annually since 2021, the 2024 figure is less than half that of 2019 and lower than the 2023 count. (Figure 1)
Looking at the daily trends, visitor numbers typically peak on New Year’s Day and then decline. They increase slightly over the first weekend, rise again during the three-day weekend in the second week (which includes Coming of Age Day), and then decrease to levels comparable to regular weekends starting from the third week onward. It appears that many visitors tend to come between “Matsu-no-uchi” (the period when the New Year deity is believed to reside in the home, lasting until January 7th, or January 15th in some regions) and “Koshogatsu” (January 15th). (Figure 2)
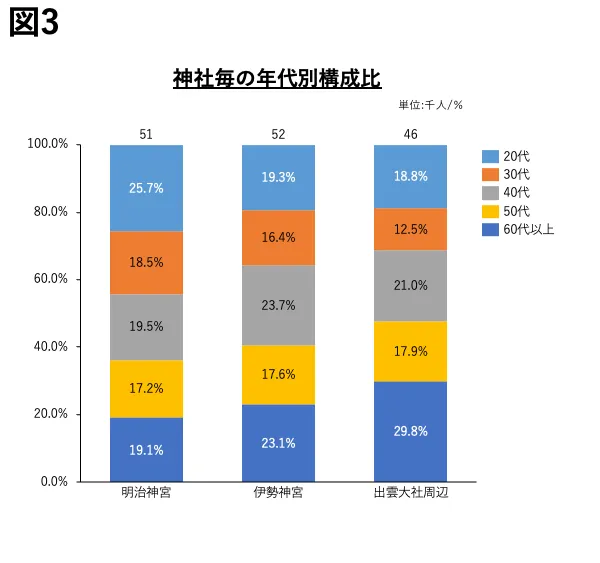
A notable characteristic of visitors to Meiji Jingu for Hatsumode is that the proportion of people in their 20s is higher compared to Ise Jingu and Izumo Taisha. This is likely due to the influence of the shrine’s location. (Figure 3)
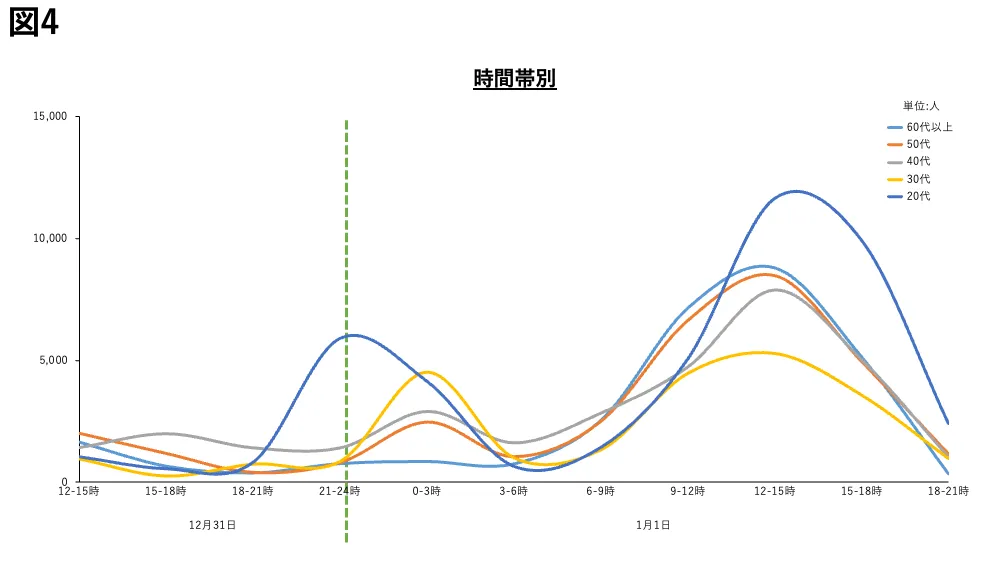
Furthermore, regarding visitors from New Year’s Eve to New Year’s Day, the high number of people in their 20s around midnight suggests that many spend New Year’s Eve at Meiji Jingu, while the high number of people in their 30s after midnight suggests that many visit after celebrating New Year’s Eve elsewhere.
After 6:00 AM on January 1, visitor numbers increase earlier in the day as the age group gets older, and it is also notable that the number of people in their 20s increases after 12:00 PM. (Figure 4)
(2) Case Study of Visitors to Remote Islands
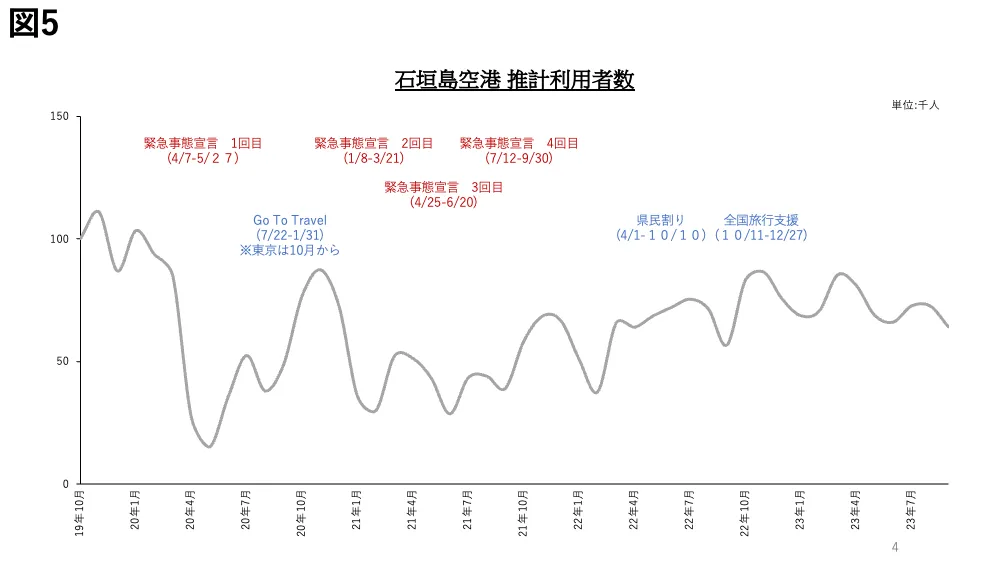
Looking at trends in Ishigaki Island Airport passenger numbers since 2019, we see a decline in passengers when a state of emergency is declared, followed by an increase during periods when tourism promotion policies—such as the National Travel Support Program—are implemented, as well as after the declaration is lifted. Although COVID-19 was reclassified to Category 5 in May 2023, passenger numbers in 2023 have not yet returned to the levels seen in October 2019, even during the summer vacation period when travel typically increases. (Figure 5)
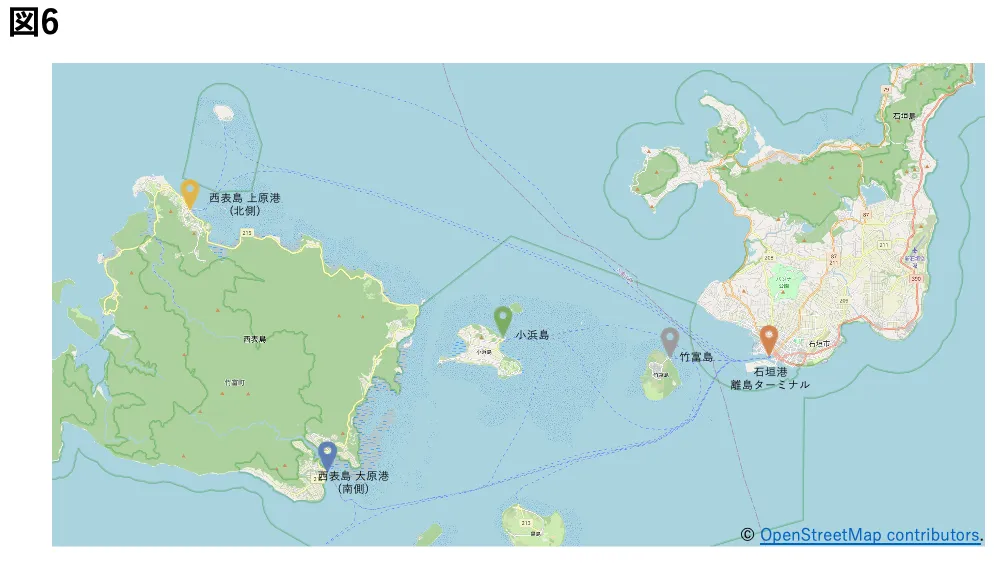
Iriomote Island, Taketomi Island, and Kohama Island are representative outlying islands accessible by ferry from Ishigaki Island. (Figure 6)
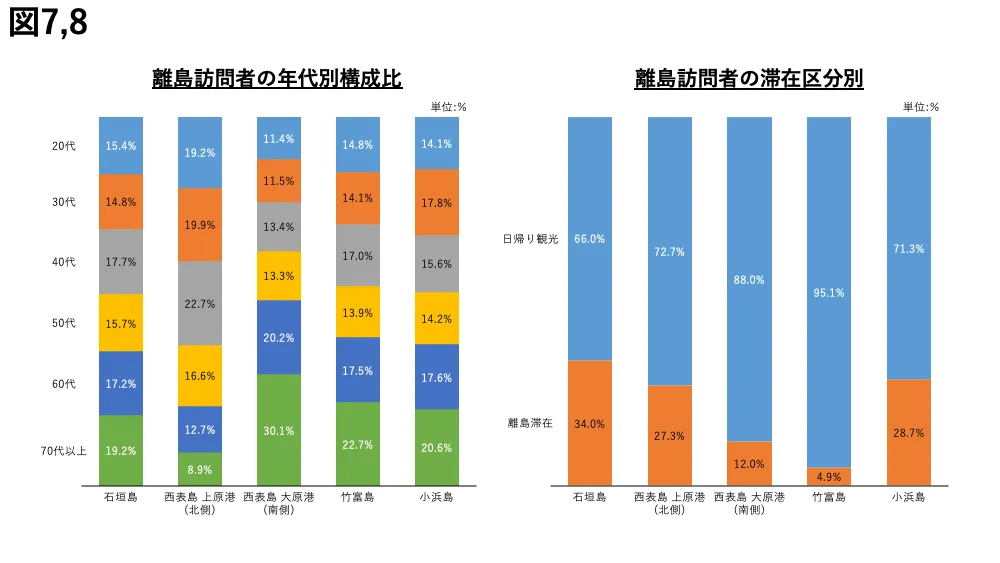
When examining the age distribution of visitors to each island, Uehara Port, located on the northern side of Iriomote Island, has a high proportion of visitors under 40 years old.It is presumed that this is due to the high number of guests staying at large, well-known family-oriented hotels that offer a wide range of activities. On the other hand, at Ohara Port, located on the southern side of Iriomote Island, the proportion of visitors aged 70 and older is high. This is likely influenced by the large number of participants in bus tours that cross the sea from Iriomote Island by ox-drawn cart to visit Yubu Island.
Furthermore, when examining whether visitors to the Ishigaki Port Remote Islands Terminal were on day trips to the various islands or were staying overnight (with visitors who visited twice or more on a given day identified as overnight guests), it is notable that the proportion of overnight guests is high at Uehara Port on Iriomote Island—which has a large hotel—and on Kohama Island. (Figure 8)
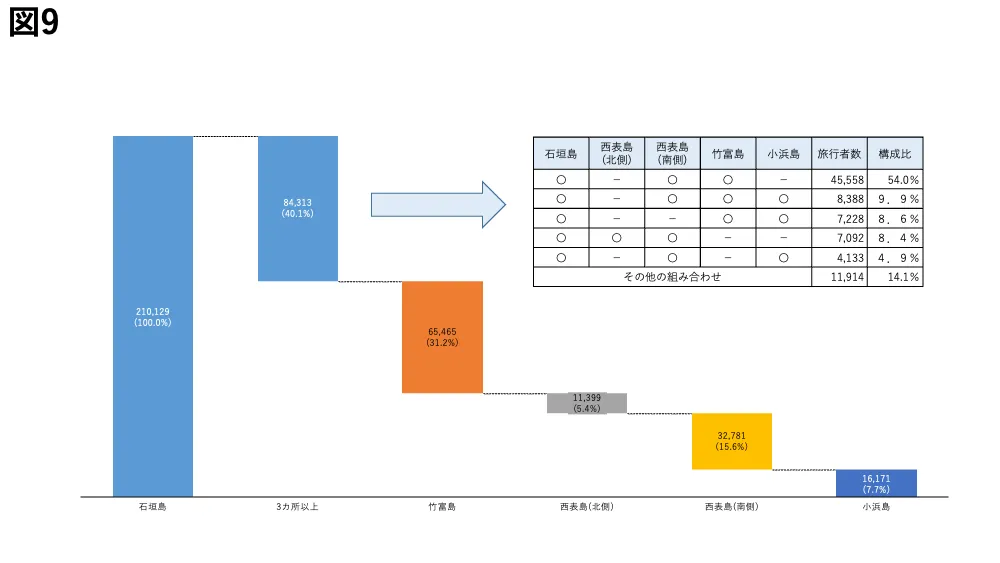
When examining travel patterns between the islands, approximately 40% of visitors to the Ishigaki Port Remote Islands Terminal visited three or more ports (including Ishigaki Island). Of these visitors who visited three or more ports, about half visited Ohara Port, located south of Iriomote Island, and Taketomi Island as a set. (Figure 9)
4. Summary
Compared to extrapolated estimates based on previous web surveys or traffic surveys, people flow data obtained using GPS location information is a highly valuable tool for understanding the characteristics of an area (and its visitors). This is because it allows for the free definition of analysis areas, enabling the assessment of people flow volume, visitor attributes, and travel patterns.
In the case of questionnaire surveys, options are often limited to specific, well-known locations, and combining visit locations with time frames can make the questionnaire complex, making data collection difficult and analysis challenging. However, people flow data utilizing GPS location information avoids the limitations of predefined options for the analysis area, as well as the risks of memory lapses and incorrect responses. It is also considered superior in terms of data accuracy.
Furthermore, people flow data allows for the analysis of visitors versus residents and the visualization of traffic volume on a street-by-street basis. It is utilized not only in the tourism sector but also in real estate (such as planning new retail locations), transportation (including traffic demand management and road maintenance), and disaster prevention and mitigation (such as addressing overtourism and natural disasters).
However, caution is required when interpreting extrapolated estimates.It is often stated that approximately 3 million people (method of estimation and source unknown) visit Meiji Shrine annually for New Year’s prayers, but the estimated number of visitors in this data set (from January 1 to 3, 2019) is just under 200,000—a significant discrepancy. It is important to note that figures must be interpreted with consideration for the purpose of the analysis, the characteristics of the data source, and the logic behind the extrapolation.
While analysis tools utilizing people flow data are extremely useful, the types of analyses that can be conducted are limited in cases where the target area is extensive and multiple inflow routes exist, or when the flow of people is low (i.e., there is little data), in addition to the situations mentioned above. Furthermore, to verify the detailed effectiveness of measures, track progress indicators, and examine insights into travelers’ preferences and sentiments, it is necessary to combine these tools with other survey and analysis methods.The key is to understand the overall picture of the plan and its underlying assumptions, and to design the data sources, surveys, and analyses to be used according to the specific objectives and circumstances.
“People flow data” is a valuable resource that can reveal many insights, but this experience also made me keenly aware that, despite being anonymized, it is highly personal and sensitive information. I believe it is crucial to maintain a sense of gratitude for being allowed to use this data and to work toward deriving insights that can be reinvested in the lives of travelers and local residents, thereby creating a virtuous cycle.
(*1) This analysis was conducted using Giken Shoji International’s “KDDI Location Analyzer.” Other representative location data services include Mobile Spatial Statistics, National Movement Statistics, People Flow Analytics®, and Data Wise Area Marketer.
= Giken Shoji International Co., Ltd. “KDDI Location Analyzer” =
The data is aggregated from au smartphone users who have provided individual consent, and is processed to ensure it cannot be used to identify specific individuals.
著者