“Tourism × Spatial Economics”: Understanding Tourism from Space: New Uses of Data in Economics

Spatial economics is the field of study that examines the distribution and differences in economic activity across regions—such as economically vibrant areas and depopulated areas—as well as the underlying economic mechanisms. In recent years, various new types of data have been attracting attention in the field of spatial economics. What are they?
1. Various Types of Data Used in Spatial Economics
I am an economist, specializing in a field known as spatial economics. The characteristics of economic activity vary greatly from region to region; while some areas, such as Tokyo, are hubs for a wide range of economic activities, others—such as rural areas experiencing depopulation—are seeing a decline in economic activity.Spatial economics is the field of study that examines the distribution and differences in economic activity across regions, as well as the underlying economic mechanisms. While my research focuses primarily on data analysis within this field, in recent years, a variety of new data sources have come into use in spatial economics.
For example, smartphone GPS data—which gained attention during the COVID-19 pandemic—allows us to track human movement at very granular spatial and temporal levels.I myself have used this smartphone GPS data to analyze the decline in consumer activity in central Tokyo during the COVID-19 pandemic. In addition, data that provides detailed insights into consumer behavior—such as credit card transaction data and point-of-sale (POS) data from supermarkets and other retailers—has increasingly been utilized in research within spatial economics and economics as a whole in recent years.
Such new data is extremely useful for policy evaluation because it provides timely information that cannot be obtained from data traditionally used by many researchers, such as government statistics. For example, during the COVID-19 pandemic, when policy decisions had to be made amid rapidly changing circumstances, it would not have been realistic to wait for government statistics—which take time from survey collection to tabulation and publication—to assess the current situation.In such situations, the value of this new, highly timely data became particularly evident. In other words, this new data complements the information that government statistics—which are important for capturing long-term trends and providing reliable, systematic data—cannot capture.
Furthermore, this type of data is extremely useful for analyzing tourism. For example, the smartphone GPS data mentioned earlier can accurately track human flow, making it possible to identify which locations attract the most visitors.In fact, we are already seeing an increasing number of studies that use smartphone GPS-based human flow data to analyze tourists. Similarly, research has been conducted using credit card transaction data to examine the purchasing behavior of tourists during their stays. Thus, this new data—whose use has been expanding in recent years in the fields of spatial economics and economics—is also extremely valuable for analyzing tourism.
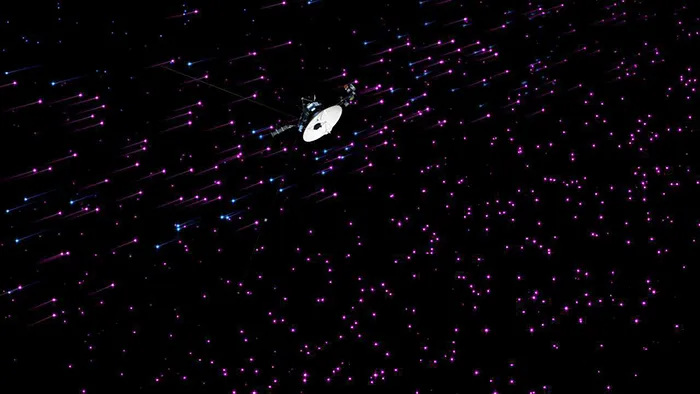
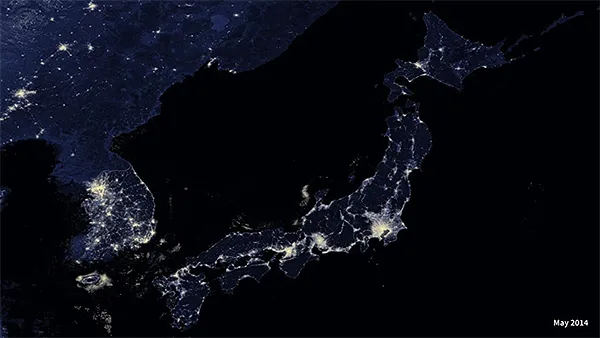
In fact, there is another type of data that is very commonly used in the field of spatial economics: satellite imagery. Some of you may have seen images of the Earth at night captured by satellites. Although no national borders are drawn on these images, the shapes of countries such as Japan and the United States are revealed by the light. This is because there is a strong correlation between economic activity and nighttime brightness.In areas with high levels of economic activity, artificial lights from streetlamps, shops, and other sources cause the area to glow brightly even at night. By leveraging this characteristic, researchers are increasingly using nighttime brightness to gauge the scale of regional economic activity and conduct various economic analyses.For example, satellite imagery showing nighttime light levels has revealed a decrease in light levels during the COVID-19 pandemic—particularly in downtown areas, where the reduction was significant due to shorter operating hours at restaurants and bars.Such data is important because it provides timely, supplementary information that official statistics cannot capture, even in developed countries with robust government statistics. Furthermore, it is utilized in various studies as essential data for gaining a detailed geographical understanding of economic activity in developing countries where data is scarce.
In recent years, the use of satellite imagery has expanded beyond nighttime light levels to include images captured during the day. The resolution of daytime satellite imagery has continued to improve; currently, the highest-resolution commercially available satellite has a spatial resolution of 0.5 meters.This means that the distance between one pixel and the next in the image corresponds to 0.5 meters; with this spatial resolution, it is possible to identify objects several meters in size, such as automobiles. By combining this technology with machine learning, it is possible to recognize various objects on the ground, which is currently greatly expanding the possibilities for research.
We are conducting research that utilizes data derived from these daytime satellite images to assess economic activity based on pedestrian traffic, and applies this to the evaluation of tourism-related policies. Specifically, we use the number of vehicles traveling on roads to gauge regional economic activity through pedestrian traffic, and thereby analyze the effectiveness of tourism-related measures.The number of vehicles traveling on a road can be considered an indicator of pedestrian traffic in that area. Of course, on major roads such as highways, vehicles passing through a given point may simply be transiting the area en route to other destinations and may not necessarily have business in that specific locality.However, vehicles traveling on smaller, more local roads are highly likely to be in the area for some specific purpose, and it seems reasonable to assume that they are closely related to the local economic activity. From this perspective, the number of vehicles on the road can be considered a proxy, to a certain extent, for the economic activity in that area as reflected by pedestrian and vehicle traffic.
Using high-resolution satellite imagery, as mentioned earlier, combined with machine learning technology, it is possible to comprehensively identify vehicles in satellite images, and there are already private companies offering such services. By utilizing this technology, it becomes possible to gauge the economic activity of a specific area based on the number of vehicles observed there.
2. Case Study of Data Utilization on Cebu Island
Following this line of thinking, we focused on Cebu Island in the Philippines—a tourist destination that is also very popular among Japanese travelers—to examine the economic impact of the opening of the new international terminal at Mactan-Cebu International Airport, the gateway to the island.
Most tourists visiting Cebu Island use Mactan-Cebu International Airport. During the 2010s, the airport reached full capacity due to the increase in tourists, leading to problems such as congestion and delays.Consequently, an airport expansion project began in 2014, and in June 2018, the new international terminal opened, expanding Mactan-Cebu International Airport’s capacity to approximately three times its previous level. Following the opening, the delay rate improved significantly—particularly for international flights—and the number of international passengers also increased.
So, how much of an impact did the opening of this new international terminal have on Cebu’s economic activity through tourism? Since most tourists visiting Cebu use Mactan-Cebu International Airport, it might seem sufficient to simply count the increase in the number of international passengers at the airport. However, there are several issues with this approach.First, it is difficult to assume that all international passengers using Mactan-Cebu International Airport are tourists.Among the passengers at Mactan-Cebu International Airport, there are likely business travelers, international students (Cebu Island is also very famous for language study programs), or simply transit passengers. It is not that easy to isolate only those traveling for tourism purposes from this group. Furthermore, where exactly tourists visit in Cebu is also an important issue.Whether the increase in tourists has an economic impact on the entire city of Cebu or only on specific areas—such as resort areas—is a crucial point to consider when evaluating the economic impact of tourism. It is difficult to have this discussion based solely on passenger data from Mactan-Cebu International Airport.
To address these issues, it would be useful to have data showing whether the flow of people presumed to be tourists increased in the Cebu metropolitan area following the expansion of international flight operations, and where exactly that increase occurred.Satellite imagery is particularly effective for this purpose. By identifying vehicles on roads using satellite imagery and analyzing the density of traffic in each area—as well as how this changed before and after the opening of the new international terminal—it is possible to measure the economic impact.If the opening of the new international terminal has led to an increase in international tourists, the flow of people in areas where these tourists are believed to be visiting should have increased, and this can be determined by counting the number of vehicles.Since there is no rail system in the Cebu metropolitan area, it is reasonable to assume that roads are used for all intra-city travel. In fact, it was found that after the terminal opened, the overall density of vehicles on roads across the entire Cebu metropolitan area increased by about 10%.
So, is this increase in foot traffic—as measured by the number of vehicles in Cebu—actually due to the airport expansion? Of course, satellite imagery cannot tell us whether tourists are actually inside those vehicles, but with some ingenuity, we can still present several pieces of indirect evidence. For example, focusing on the timing is effective.Tourism has peak and off-peak seasons. In Kyoto, for instance, more tourists than usual visit during the autumn foliage season or the Gion Festival. If foot traffic in Kyoto increased during these periods, it would be safe to say that the increase was due to tourists. A similar approach can be applied to this case.Cebu also has peak and off-peak tourist seasons. Furthermore, these periods differ between international and domestic tourists. Therefore, if the increase in the number of vehicles were observed more frequently during peak seasons for international tourists, it could be attributed to an increase in international tourists.In fact, our research found that the number of vehicles increased more significantly during peak periods for international tourists in Cebu, and that this phenomenon was particularly pronounced on Mactan Island, where resort hotels are concentrated. This suggests that the increase in foot traffic in Cebu City is due to the rise in international tourists following the opening of the new international terminal at Mactan-Cebu International Airport.
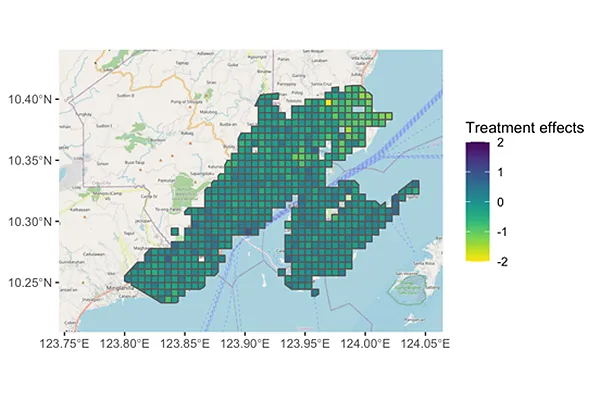
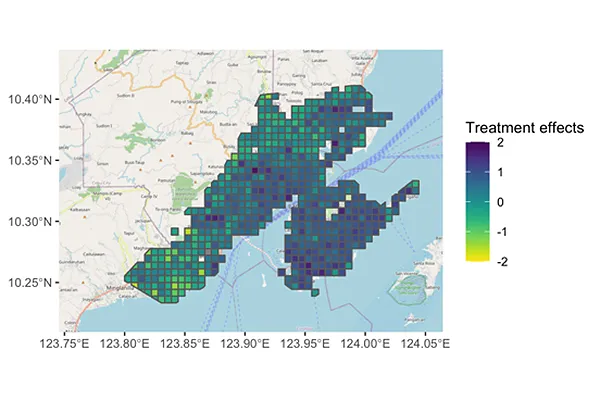
(Figure: Vehicle Density Increase Following the Opening of the New International Terminal)
The island on the far right of the figure is Mactan Island, famous for its resorts. The darker the color, the greater the increase in vehicle density following the opening of the new international terminal. It can be seen that vehicle density is higher during peak periods than during off-peak periods, and that this increase is more pronounced on Mactan Island.
Source: Eugenia Go, Kentaro Nakajima, Yasuyuki Sawada, and Kiyoshi Taniguchi (2023) Satellite-Based Vehicle Flow Data to Assess Local Economic Activities, CIRJE Discussion Paper Series, #F-1209
We also calculated the economic impact resulting from the increase in foreign tourists following the terminal’s opening and found that this impact would generate sufficient economic benefits to recoup the airport construction costs within 10 years. This method is extremely useful for conducting detailed evaluations of the effectiveness of tourism infrastructure and enables highly accurate analysis even in regions where tourist numbers fluctuate significantly by season.
As such, daytime satellite imagery provides a wealth of useful information regarding tourism. I believe that, with the right approach, it is possible to obtain a wide variety of information beyond just vehicle counts, as in our study.For example, assessing the value of urban green spaces could be an interesting application. Research already exists that uses satellite imagery to identify urban green spaces and analyze their impact on a city’s value. Such information will be crucial when considering a region’s appeal.
With the Basic Plan for Promoting Japan as a Tourism-Oriented Nation approved by the Cabinet, and as Japan’s tourism industry continues to flourish, many accompanying issues are also emerging. While government statistics are certainly useful for analyzing these issues, it is also important to grasp the situation with greater timeliness.In addressing these issues, data held by private companies—such as smartphone GPS data, credit card transaction information, and POS data, as introduced at the beginning of this article—as well as satellite imagery data like that discussed here are considered extremely useful. It is important to utilize this new data to formulate appropriate, data-driven policies and measures.
著者