In the World Economic Forum’s (WEF) “Travel and Tourism Development Index (2024),” Japan ranked third, behind the United States and Spain.
In the "Travel and Tourism Development Ranking (2024)" released in May 2024, Japan ranked third, behind the United States and Spain, securing a spot in the top three. Let’s take a look at the key factors behind this ranking.
On May 21, 2024, the World Economic Forum (WEF) released its 2024 Travel & Tourism Development Index, in which Japan ranked third, behind the United States (1st) and Spain (2nd).While this ranking is based on a limited set of indicators and does not tell the whole story, it serves as a valuable resource for understanding how Japan is perceived globally and for identifying its strengths and challenges when compared to other countries and regions.
I would like to examine the key points of Japan’s evaluation in the 2024 edition by looking at changes in indicators since the 2021 edition (released in 2022) and comparisons with the United States and Spain (Table 1).
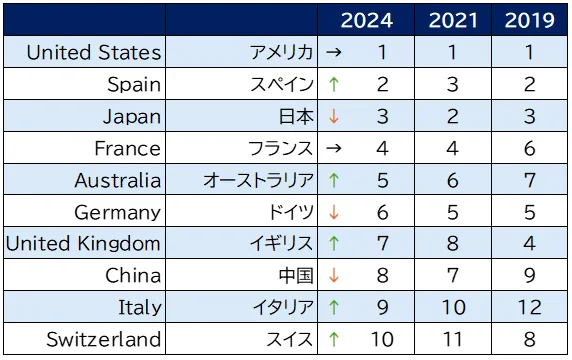
for 2019 and 2021 were calculated using the 2024 criteria
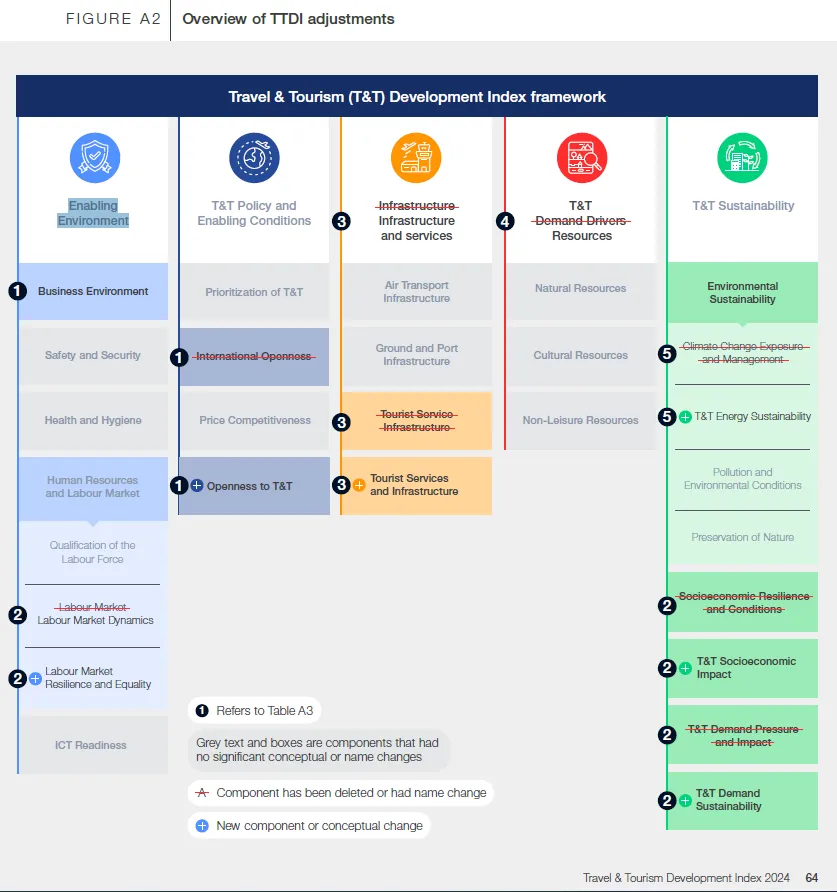
Changes to the Indicators in the 2024 Edition
The various indicators used in the “Travel & Tourism Development Index” undergo frequent changes with each edition, making direct comparisons with past results difficult. Incidentally, while Japan was ranked first in the 2021 edition, it is now ranked second based on results recalculated following the recent indicator changes.
The following six indicators were changed or newly introduced between the 2021 and 2024 editions:
- Labour Market Resilience and Equality
- Tourist Services and Infrastructure
- Openness to Travel and Tourism
- T&T Energy Sustainability
- Socioeconomic Impact of Travel and Tourism
- Sustainability of Travel and Tourism Demand
Notably, significant changes include the addition of indicators such as equal employment opportunities and social security systems under “Labor Market Sustainability and Equity”; the inclusion of labor efficiency in accommodation facilities and restaurants as an evaluation criterion under “Tourist Services and Infrastructure”; and, as evidenced by the inclusion of the term “T&T (Travel and Tourism)” in four of the indicators, a greater focus on the travel and tourism market—specifically, indicators such as the “level of hospitality” in each country or region,environmental performance metrics limited to travel and tourism—such as carbon emissions—and the share of travel and tourism (direct, indirect, and induced) in GDP) (Figure 1).
Among the indicators in this year’s assessment, the top five areas where Japan received high scores were “Cultural Resources,” “Health and Hygiene,” “Ground and Port Infrastructure,” “ICT Readiness,” and “Safety and Security.” Looking at past rankings, Japan has consistently scored highly in these areas, confirming that they remain the country’s strengths.
On the other hand, the indicators that showed the largest decline in scores compared to the recalculated 2021 figures were “Travel and Tourism Demand Sustainability” and “Tourist Services and Infrastructure.” In particular, evaluations regarding “labor efficiency in accommodation and food service establishments” and “concentration of international travelers during peak seasons” were low.Regarding labor, the evaluation of “availability of skilled staff in local areas” also showed a slightly lower trend. As Japan responds to the rapid recovery in inbound tourism following the COVID-19 pandemic, challenges such as efficiency, temporal and geographical dispersion, and securing local talent—all necessary to prevent the emergence of overtourism issues—have once again been brought to the forefront.
Japan’s Strengths and Weaknesses Compared to the U.S. and Spain
Next, we will examine Japan’s characteristics by comparing them with the differences between the United States (ranked 1st) and Spain (ranked 2nd) (Table 2).
The indicators that received high ratings in the United States were “ICT infrastructure,” “air transport,” “natural resources,” and “non-leisure resources.” The “natural resources” category was evaluated based on factors such as the number of natural heritage sites and the size of protected areas, while “non-leisure resources” were assessed based on the presence of global companies and global cities, the quality of universities, and the number of online searches for business travel, educational travel, and health tourism.
The indicators that received high ratings in Spain included “Safety and Security,” “Cultural Resources,” and “Air Transport.” Regarding “Safety and Security,” factors such as trust in local police, the safety of walking at night, and the number of doctors were evaluated, resulting in higher scores than Japan.While Japan has an image of being a safe country, it is essential not to rest on our laurels but to continuously work toward creating an environment where travelers feel secure, including during disasters. For “Cultural Resources,” the evaluation covers tangible and intangible cultural heritage, the number of sports stadiums, and the volume of online searches related to cultural resources. Although Spain has few indicators where it scores significantly higher than the United States, it also has few low scores, suggesting a generally balanced performance.
The indicators where Japan received particularly high scores were “Land and Port Infrastructure,” “Cultural Resources,” and “Non-Leisure Resources.” Regarding “Land and Port Infrastructure,” Japan received high marks for the quality of its road network, the efficiency of rail and port transportation, and the quality of public transportation. In “Cultural Resources,” similar to Spain, Japan tended to score highly on intangible cultural heritage, the number of sports stadiums, and the number of online searches related to cultural resources.In the “Non-Leisure Resources” category, factors such as the number of global companies and the volume of online searches for business travel, educational travel, and health tourism were evaluated.
On the other hand, Japan scored lower than the United States in “Natural Resources.” However, while Japan does not match the U.S. in terms of the number of natural heritage sites or species diversity, it surpassed the U.S. in the number of online searches for natural resources, suggesting high demand from travelers.
Regarding “Air Transport,” while Japan did not rank particularly high, a closer look at the breakdown reveals that its scores for factors such as airport connectivity and the efficiency of air services were by no means low. Given that some items included in the indicators were not quantified—possibly due to the impact of the COVID-19 pandemic—it may be best to wait for the next evaluation regarding the “Air Transport” score.
As mentioned at the beginning, these results do not tell the whole story, but they have once again demonstrated that addressing overtourism, environmental protection, and securing a skilled workforce are crucial for Japan’s tourism industry to achieve a healthy recovery and dramatic growth following the impact of the COVID-19 pandemic.
Furthermore, while providing international travelers with safety and security—such as environments where they can walk safely at night and disaster response (tourism crisis management)—there also appears to be potential in enhancing information and services for travelers seeking natural resources (including adventure tourism), as well as in non-tourism sectors such as business, education, and health tourism.
Furthermore, starting in April 2024, Japan launched a residency program allowing “digital nomads”—who use IT to work while traveling around the world—to stay and work in the country for up to six months. We hope that attracting travelers beyond just tourists will help avoid seasonal and regional concentration of visitors to Japan.
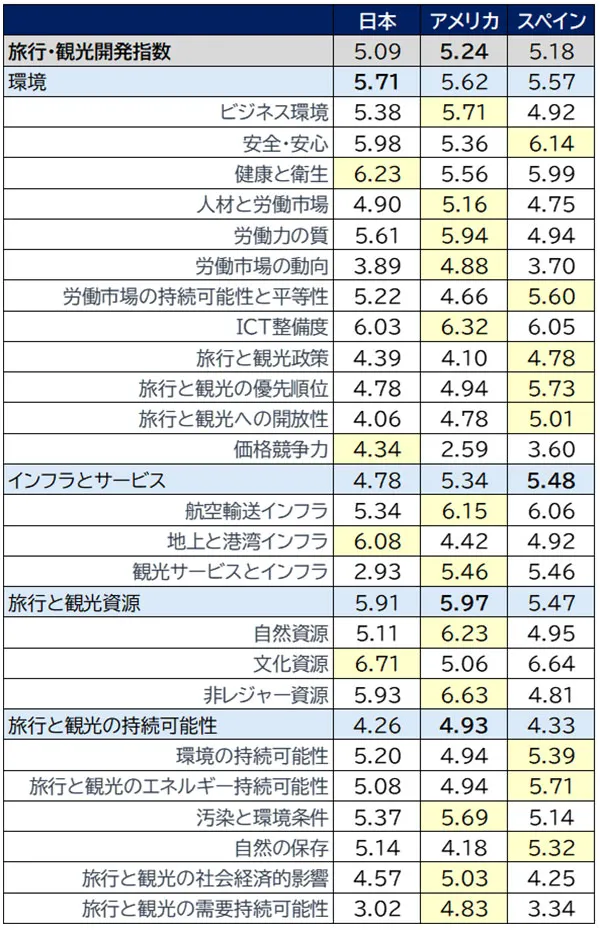
*Yellow shading indicates the highest score among the three countries