We have released the "JTB Regional Power Index 2025"
PDFダウンロード
公開日
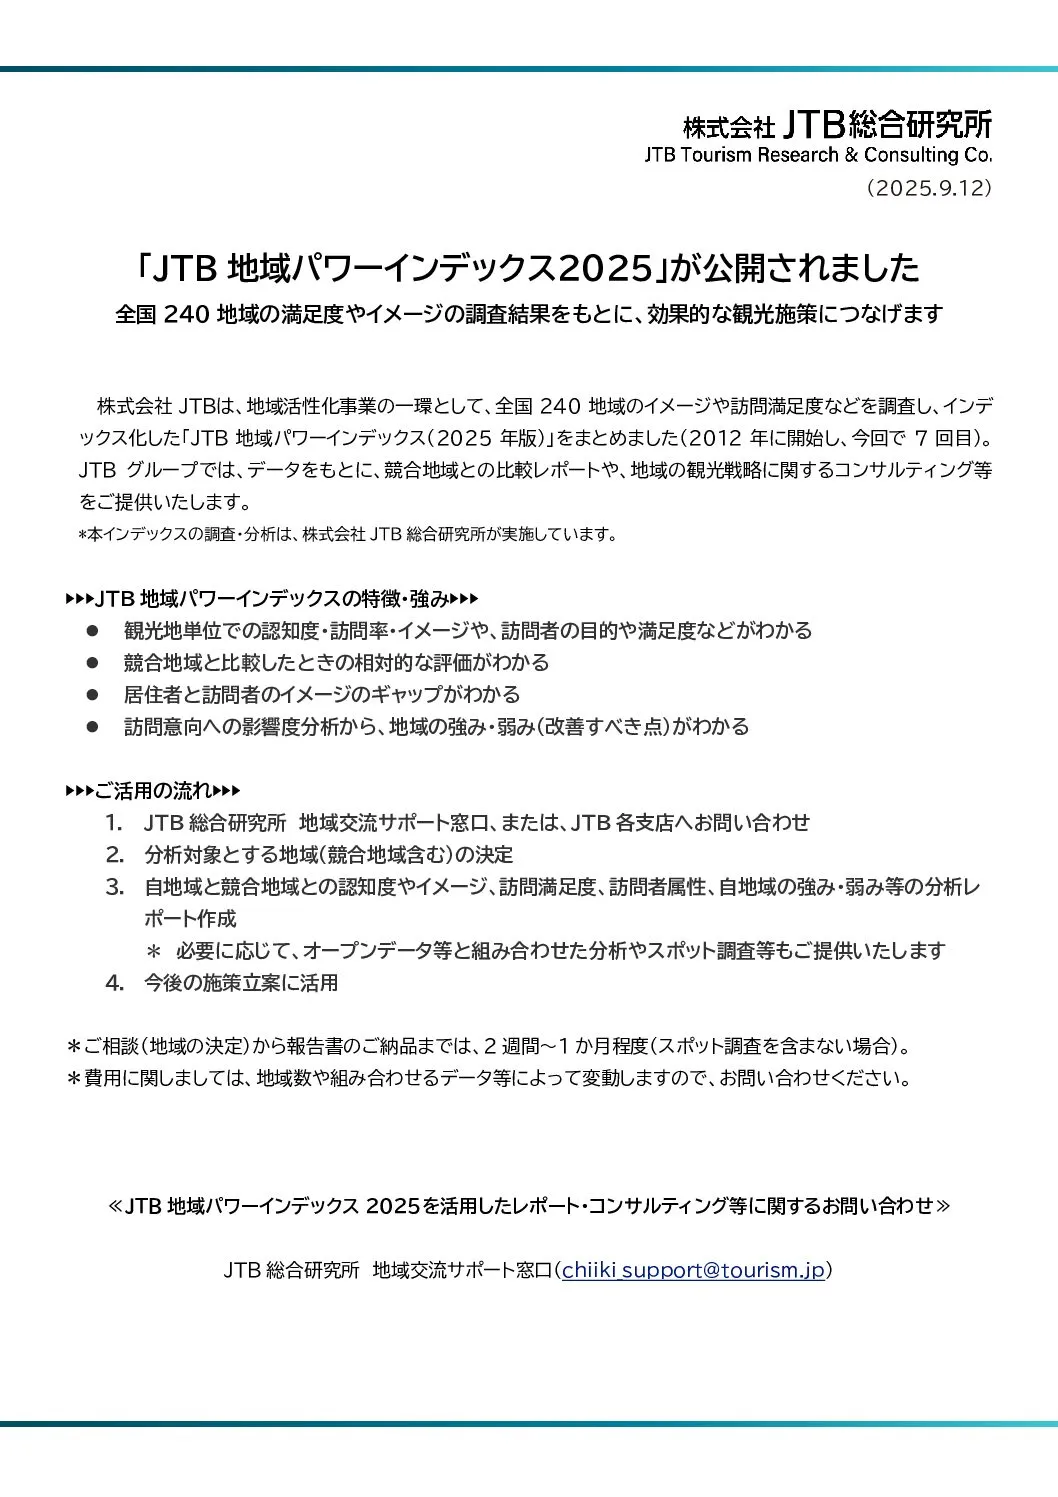
As part of its regional revitalization initiatives, JTB Corporation has compiled the “JTB Regional Power Index (2025 Edition),” which surveys and indexes the image and visitor satisfaction levels of 240 regions nationwide (launched in 2012, this is the seventh edition).Based on this data, the JTB Group provides comparative reports with competing regions and consulting services regarding regional tourism strategies.
*The research and analysis for this index are conducted by JTB Tourism Research & Consulting Co., Ltd.
*The research and analysis for this index are conducted by JTB Tourism Research & Consulting Co., Ltd.
Features and Strengths of the JTB Regional Power Index
- Provides insights into awareness, visitation rates, and image by tourist destination, as well as visitors’ purposes and satisfaction levels
- Understand relative performance compared to competing regions
- Identifies the gap between residents’ and visitors’ perceptions
- Analysis of factors influencing visitation intent reveals the region’s strengths and weaknesses (areas for improvement)
How to Use This Service
- Please contact the JTB Tourism Research & Consulting Regional Exchange Support Desk or any JTB branch
- Determination of target regions for analysis (including competitor regions)
- Preparation of an analysis report covering awareness and image, visitor satisfaction, visitor demographics, and the strengths and weaknesses of your region and competitor regions *If necessary, we can also provide analyses combining open data and other sources, as well as spot surveys
- Use the results to plan future initiatives
*The process from consultation (determining the region) to delivery of the report takes approximately 2 weeks to 1 month (excluding spot surveys).
*Costs vary depending on the number of regions and the data used, so please contact us for details.
Examples of report content:
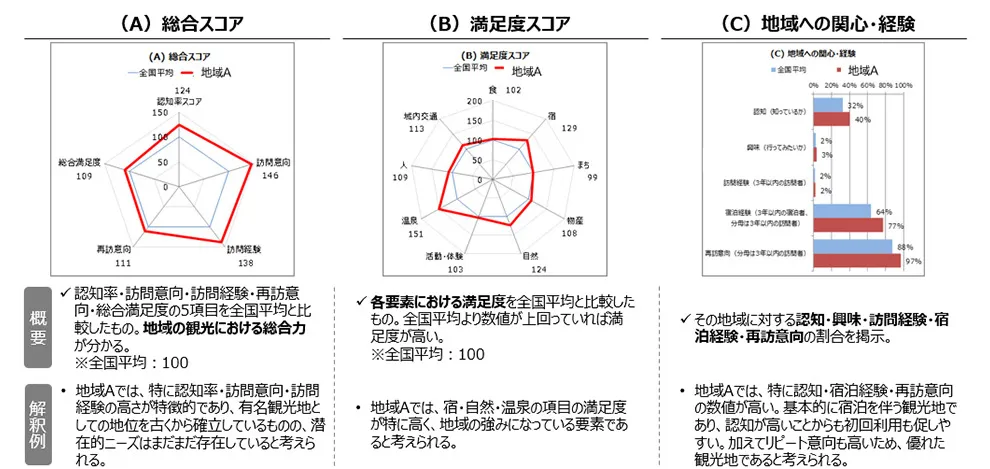
What the JTB Regional Power Index Reveals (Examples of Survey Content)
1. Indexing of Overall Scores and Satisfaction Scores
2. Identifying differences based on visitor demographics and the perception gap between visitors and residents
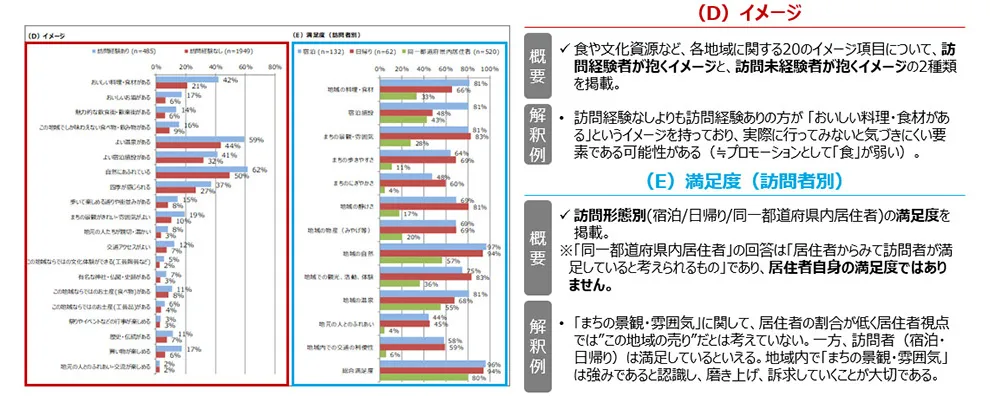
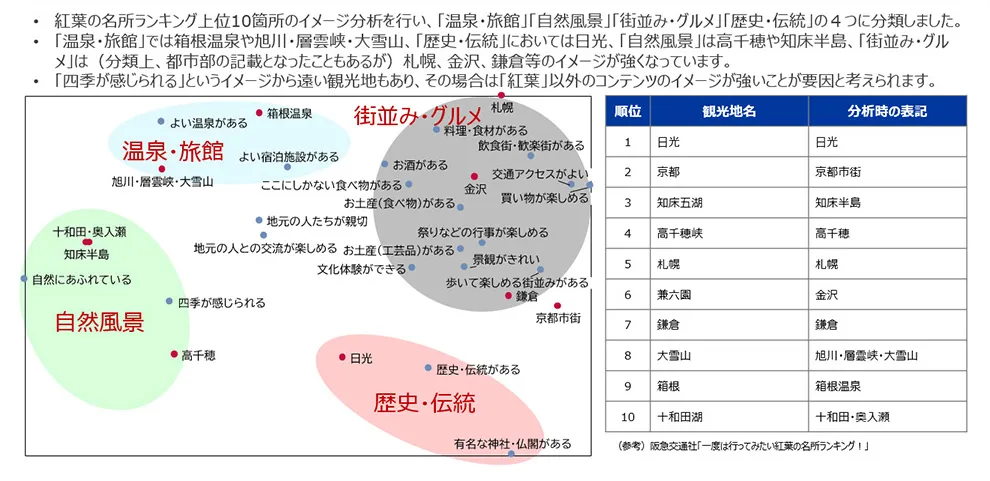
3. Understanding differences in image compared to competing regions (e.g., image analysis of autumn foliage spots)