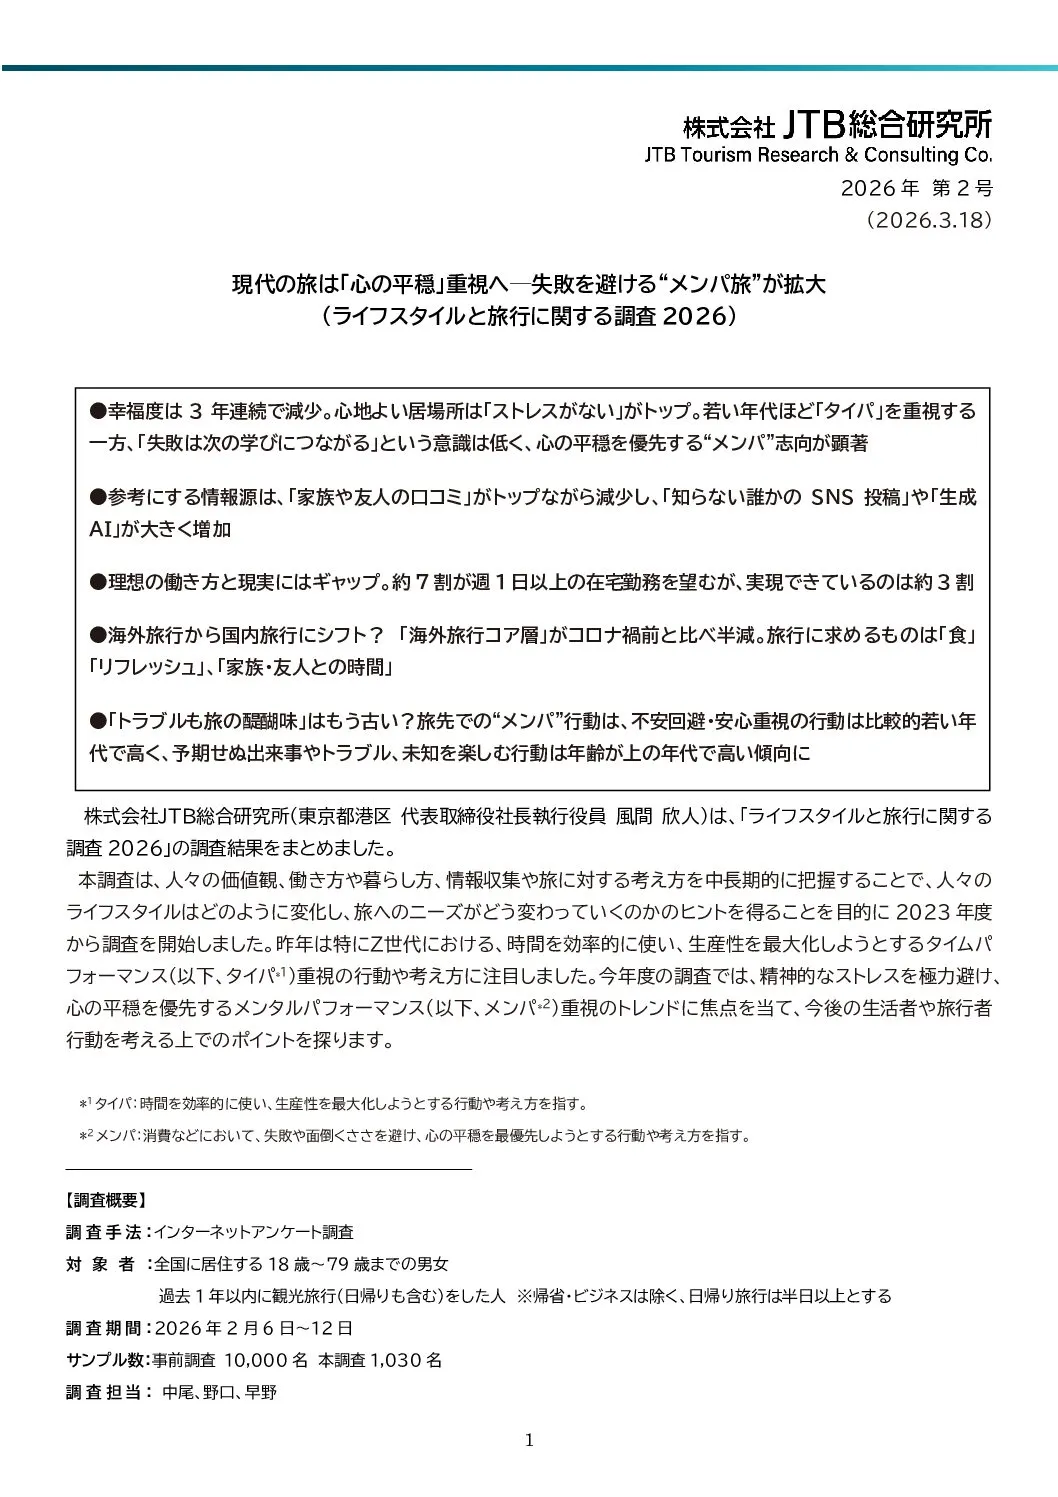
2026 Lifestyle and Travel Survey: Travel in the Reiwa Era Shifts Toward "Peace of Mind"—"Risk-Averse Travel" Gains Popularity
This survey was launched in 2024 with the aim of gaining insights into how people’s lifestyles are changing and how travel needs are evolving by understanding their values, work and living styles, and attitudes toward information gathering and travel from a medium- to long-term perspective.Last year, the survey focused particularly on Generation Z’s behaviors and mindsets centered on “time performance” (hereinafter “Taipa”*1)—an emphasis on using time efficiently to maximize productivity.In FY2023’s survey, we focus on the trend of prioritizing “mental performance” (hereinafter “Menpa”*2)—which involves avoiding mental stress as much as possible and prioritizing peace of mind—to identify key insights for understanding future consumer and traveler behavior.
*1 "Time Performance" (hereinafter "Tipa"*1): Refers to behaviors and mindsets aimed at using time efficiently and maximizing productivity.
*2 "Mental Performance" (hereinafter "Menta"*2): Refers to behaviors and mindsets aimed at prioritizing peace of mind by avoiding failure and hassle in consumption and other activities.
Key Findings
- Happiness levels have declined for two consecutive years. The top factor for a comfortable living environment is “no stress.” While younger generations place greater importance on “time efficiency,” they have a lower awareness that “failure leads to future learning,” and a pronounced preference for “mental peace” is evident.
- While "word of mouth from family and friends" remains the top source of information, its share has declined, while "social media posts by strangers" and "generative AI" have seen a significant increase.
- There is a gap between the ideal work style and reality. While about 70% of employees want to work from home at least one day a week, only about 30% are able to do so.
- Shift from overseas to domestic travel? The "core overseas travel demographic" has halved compared to pre-pandemic levels. What travelers seek most is "food," "relaxation," and "time with family and friends."
- Is the idea that “troubles are part of the fun of travel” outdated? When it comes to behavior while traveling, a tendency to avoid anxiety and prioritize peace of mind is more common among younger people, while a tendency to enjoy unexpected events, troubles, and the unknown is more common among older people.
Happiness and Life Values
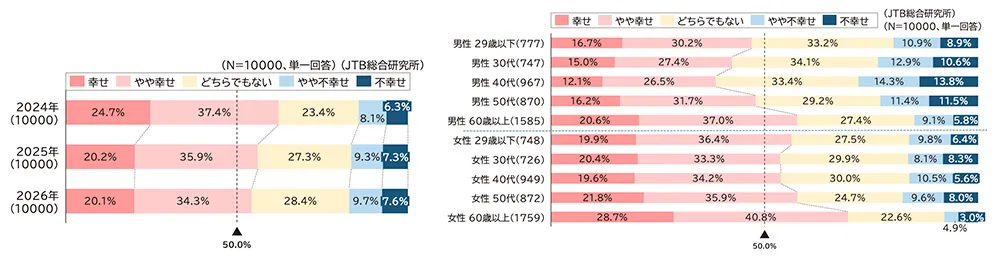
Happiness with current life has been on a downward trend for two consecutive years, with men in their 40s and women in their 30s reporting the lowest levels. Sources of fulfillment include “being helpful to family” and “improving one’s health.”
When preliminary survey respondents were asked about their current life satisfaction, both “happy” and “somewhat happy” responses declined for the second consecutive year. Overall, women tended to report higher levels than men, and when broken down by gender and age group, those in their 60s and older reported the highest levels for both men and women.On the other hand, men in their 40s and women in their 30s reported the lowest levels (Figures 1 and 2).
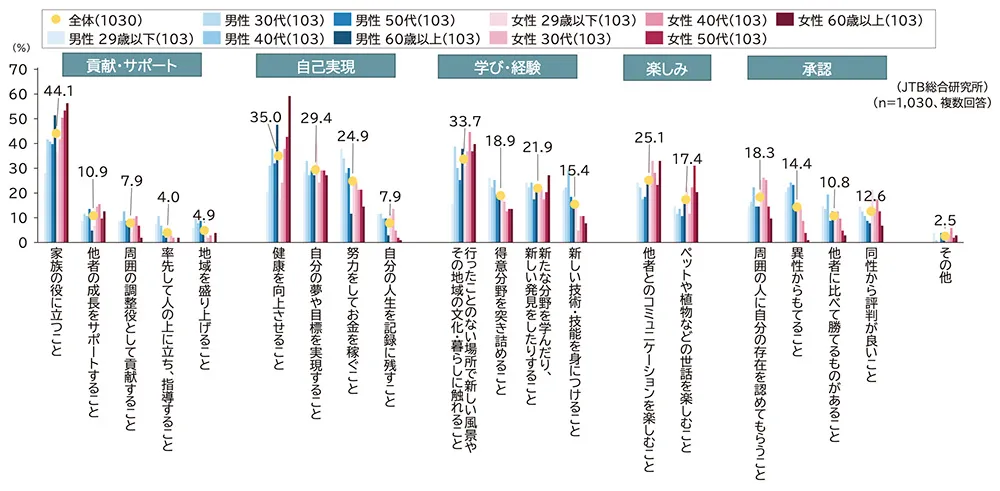
The top sources of a sense of purpose were, in order: “being helpful to my family (44.1%),” “improving my health (35.0%),” and “experiencing new scenery and the local culture and way of life in places I have never been before (33.7%).” When broken down by age group, the percentages for “being helpful to family” and “improving health” tend to increase with age.On the other hand, “working hard to earn money” was highest among men aged 29 and under at 37.9%, while “realizing one’s dreams and goals” was highest among women aged 29 and under at 39.8% (Figures 3).
Typing and Memo-Taking Behaviors and Information Gathering in Daily Life
The value placed on time that seems wasted or time spent doing nothing varies by age group. While
younger people tend to want to avoid wasting time, they are more likely to consider time “not wasted” if they are doing
something at the same time. The belief that “failure leads to future learning” is higher among men and women in their 50s and older, while it tends to be lower among those aged 29 and under.
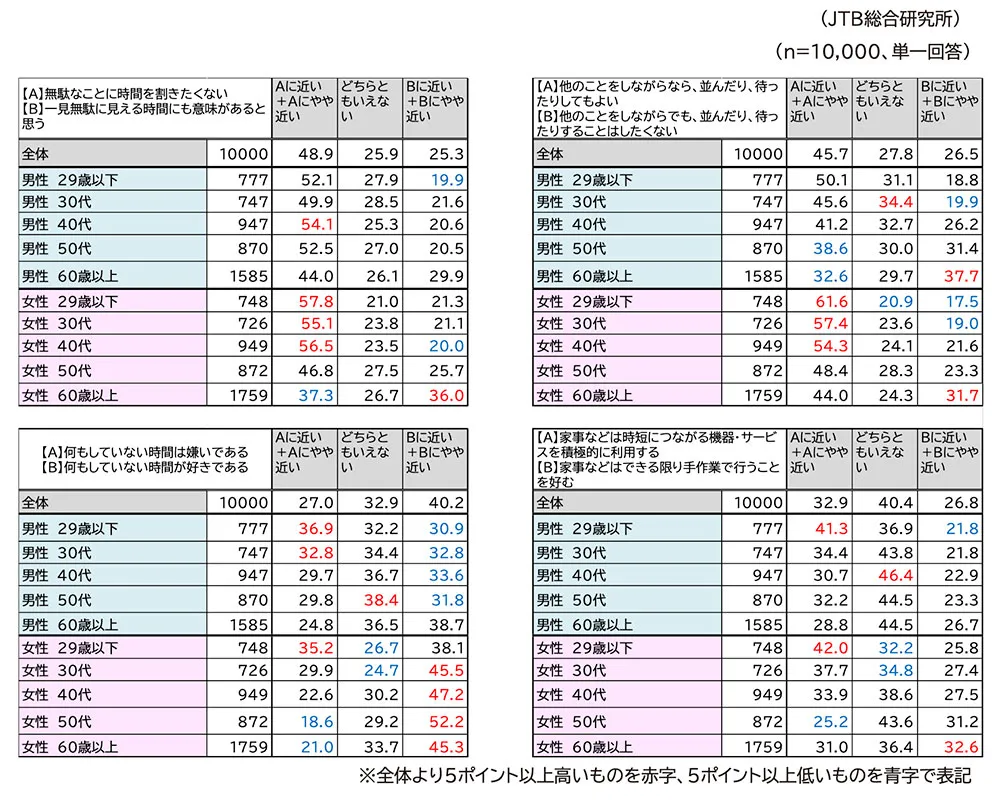
Next, we asked the survey respondents about their daily behaviors regarding time efficiency and mental efficiency. Regarding attitudes toward time management, the statement “I believe even time that seems wasted at first glance has meaning” was most common among men and women in their 60s and older, while “I enjoy doing nothing” was particularly high among women in their 30s and older.Among both men and women in their 40s and younger, the responses “I don’t want to spend time on useless things” and “I dislike doing nothing” were high, while the response “It’s okay to stand in line or wait if I’m doing something else” increased as the age group decreased.While people want to avoid wasting time, younger generations tend to view time spent doing something else as “not wasted.” Additionally, while over 40% of men and women aged 29 and under said they “actively use devices and services that save time on housework,” this figure was lowest among women in their 50s at 25.2% (Figure 4).
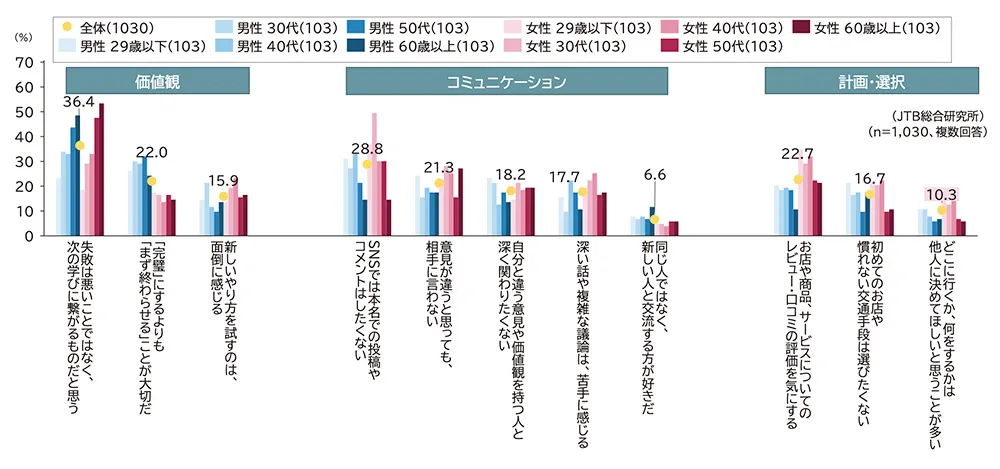
Regarding daily behaviors, feelings, and attitudes, the top responses were: “I think failure isn’t a bad thing; it leads to future learning (36.4%),” “I don’t want to post or comment using my real name on social media (28.8%),”“I care about reviews and ratings of stores, products, and services (22.7%).”
When broken down by gender and age group, the response “I think failure is not a bad thing, but rather a learning opportunity for the future” was highest among those in their 50s and older for both men and women, with a tendency for the percentage to decrease as the age group became younger.Regarding communication, the response “I don’t want to post or comment using my real name on social media” was higher among younger age groups for both men and women, with women in their 30s at 49.5% and women in their 20s at 36.9%. On the other hand, there were no significant differences by gender or age group for items related to exchanging opinions or having deep conversations with others.The response “I care about reviews and ratings of stores, products, and services” was higher among women in their 40s and younger (Figure 5).
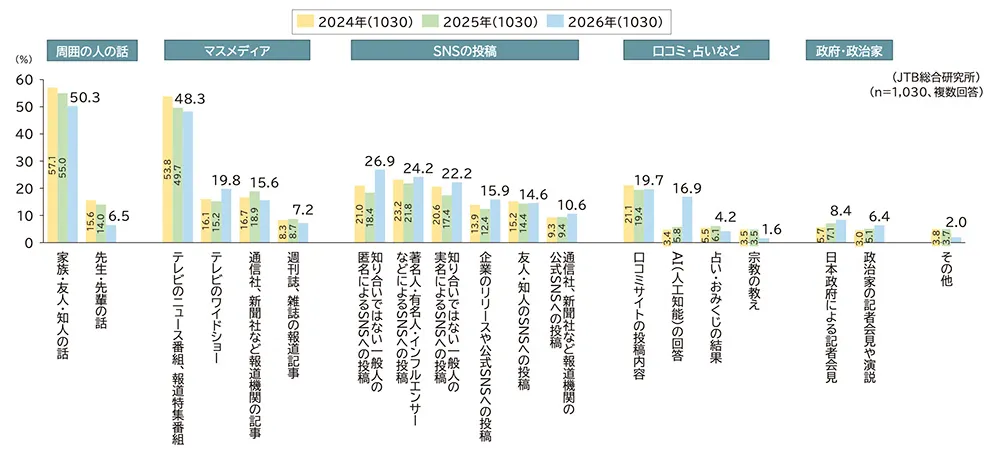
The top sources of reference information were “stories from family, friends, and acquaintances” and “TV news programs and special news reports.” In terms of growth rate, “anonymous social media posts by strangers” and “AI responses” have surged for two consecutive years.
We asked about the information people refer to in their daily lives. Overall, the top sources were “stories from family, friends, and acquaintances (50.3%),” “TV news programs and special reports (48.3%),” and “anonymous social media posts by members of the general public whom they do not know (26.9%).”All options related to “social media posts” increased compared to the previous year, but the rate of increase varied depending on the type of poster.The growth rate for “anonymous members of the public whom I do not know” was particularly high, rising by 8.5 percentage points from the previous year, while “friends and acquaintances” increased by 0.2 percentage points and “official sources from news agencies, newspapers, and other media outlets” increased by 1.2 percentage points.While “stories from family, friends, and acquaintances” remain the most trusted source of information, it may be “anonymous members of the general public whom I do not know”—who are far removed from me—who provide access to a wide and diverse range of information, offering new perspectives, inspiration, and creative opportunities.Additionally, “AI (artificial intelligence) responses (16.9%),” whose use has been rapidly growing in recent years, increased by 11.1 percentage points from the previous year, resulting in the highest growth rate among all categories. It is expected that the efficiency of information acquisition will continue to accelerate (Figure 6).
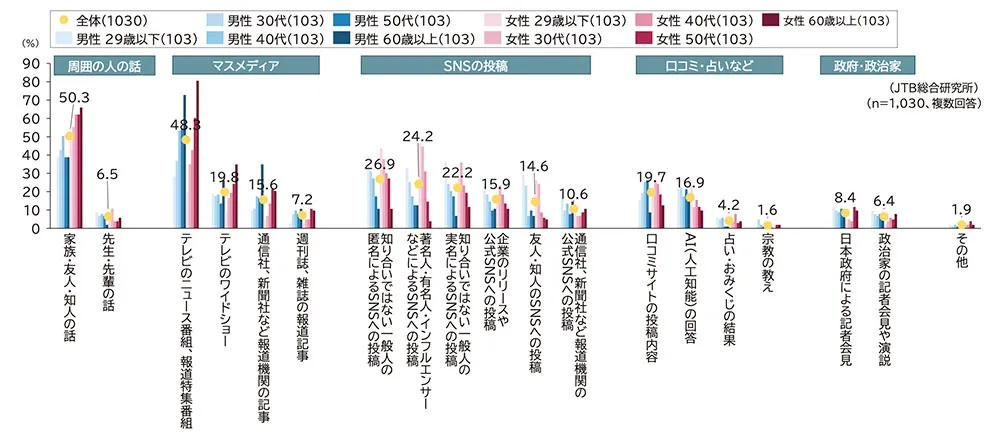
When broken down by gender and age group, the use of mass media was higher among older age groups, while the selection rates for social media, word of mouth, and AI were higher among younger age groups.Although not shown in the chart, compared to the previous year, “anonymous posts on social media and YouTube by members of the general public whom I do not know” and “AI (artificial intelligence) responses” increased across all demographic categories (Chart 7).
The Ideal Lifestyle: Personal Space and Where to Live
A comfortable place to be is one where there is “no stress,” where one can “secure personal time and space,” and where one can “be oneself without putting on airs.” As for neighborhood interactions, “exchanging greetings or having a brief chat is sufficient.”
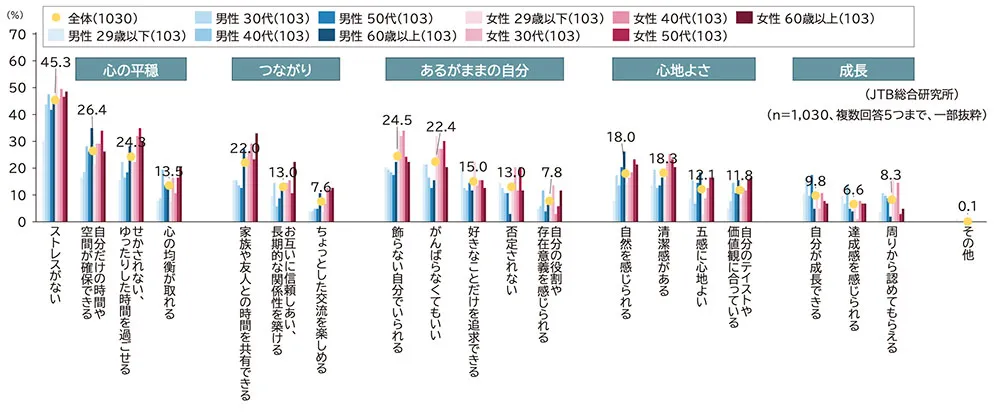
The top factors for a comfortable living space, in order, were “no stress (45.3%),” “having time and space to myself (26.4%),” and “being able to be my authentic self (24.5%).”
When broken down by gender and age group, women aged 29 and under had the highest percentages across all categories for “no stress (54.5%)” and “not having to try so hard (32.0%)”; additionally, women aged 29 to their 40s had a high percentage for “being able to be my authentic self.”Furthermore, for both men and women aged 29 and under, “being able to pursue only what I like” was also high, suggesting they find comfort in pursuing their interests without stress or strain (Figure 8).
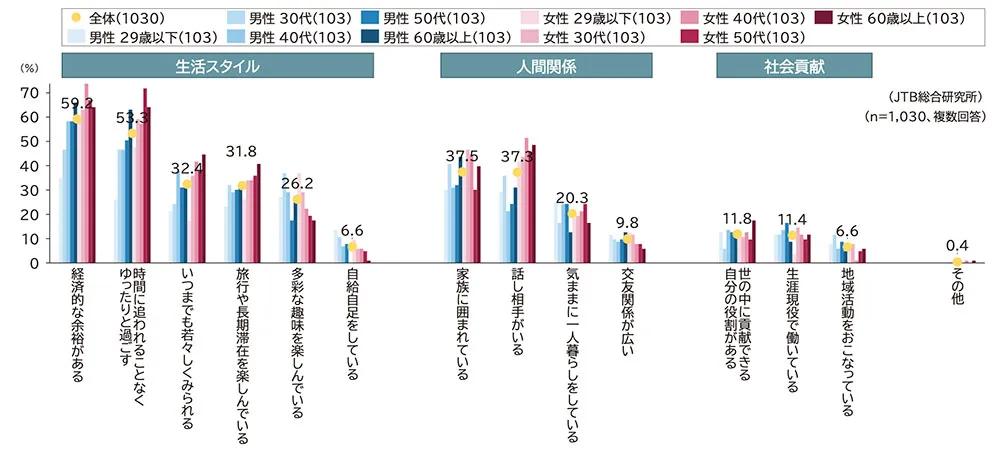
Regarding their ideal lifestyle, the top responses were “having financial security (59.2%),” “living a relaxed life without being pressed for time (53.3%),” and “being surrounded by family (37.5%).”When broken down by gender and age group, women in their 40s and older ranked “spending time at a leisurely pace without being rushed,” “having someone to talk to,” and “looking youthful forever” highly, while men in their 30s and women aged 29 and under ranked “enjoying a variety of hobbies” highly (Chart 9).
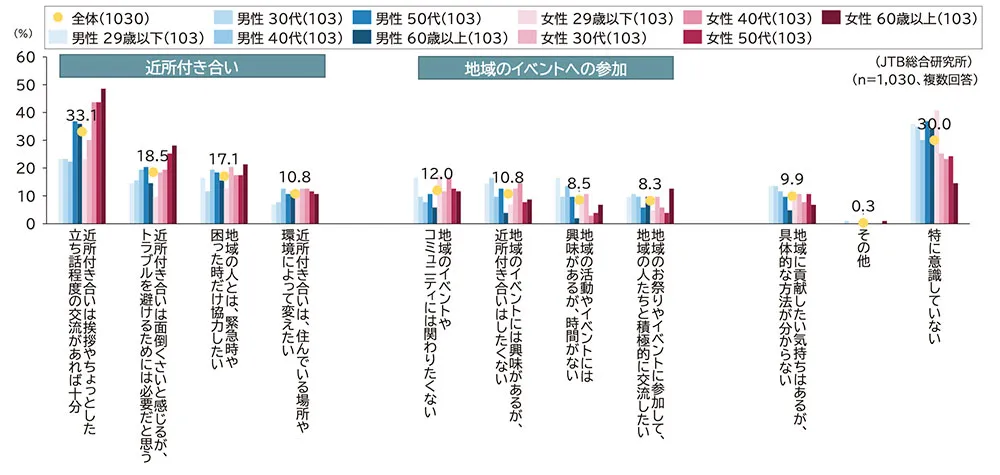
When asked about neighborhood relations, “Exchanging greetings or having brief chats is sufficient” was the most common response at 33.1%, followed by “I find neighborhood relations a hassle, but I think they are necessary to avoid trouble (18.5%),”and “I only want to cooperate with people in the community in emergencies or when I’m in trouble” (17.1%). Among women in their 40s and older, “Interaction with neighbors is sufficient if it consists of greetings or brief chats” accounted for over 40%.On the other hand, among younger men, while there is interest in community activities and events, a significant number cited “lack of time” or stated they “do not want to engage in neighborhood interactions.” If these bottlenecks are resolved, they may become more positive about engaging with the community (Figure 10).
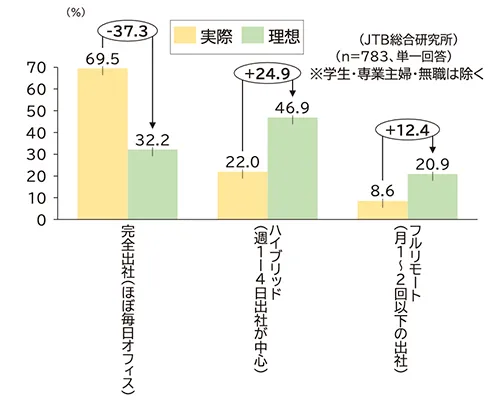
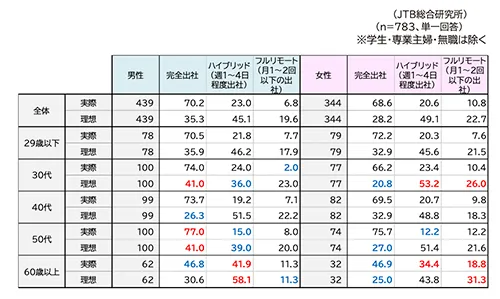
A gap between ideal and actual work styles. About 70% want to work from home at least one day a week, but only about 30% are able to do so. Men aged 29 and under choose their place of residence based on “compatibility with hobbies” and “work.”
We asked about the gap between ideal commuting frequency and work styles versus reality, as well as how respondents currently choose their place of residence. Regarding ideals, the results were “Full on-site work (32.2%),” “Hybrid (46.9%),” and “Fully remote (on-site work once or twice a month or less) (20.9%).”However, when compared to actual frequency, “full on-site work (69.5%)” showed a 37.3% gap from the ideal, and all other categories were less than half of the ideal, revealing a disconnect between ideal and reality (Figures 11 and 12).
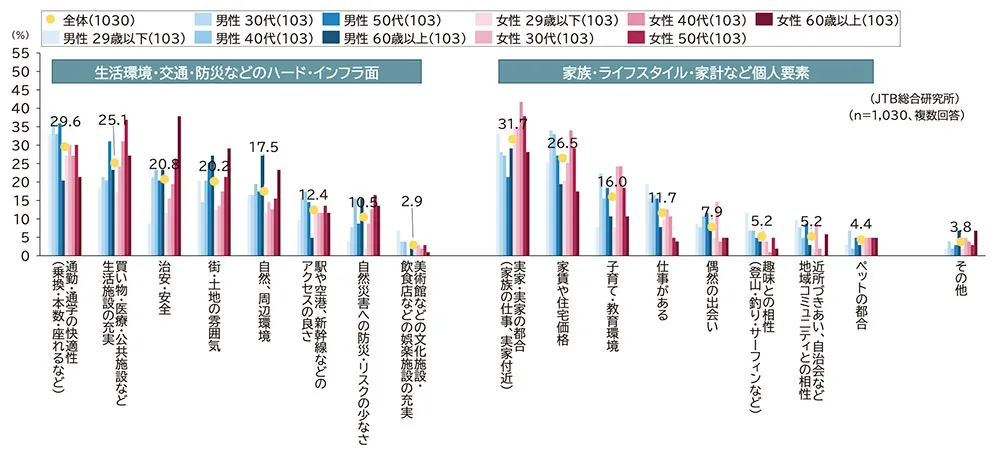
Regarding the reasons for choosing their current place of residence, the top three were “Parents’ home or family circumstances (31.7%),” “Convenience of commuting to work or school (29.6%),” and “Rent or housing prices (26.5%).”When broken down by gender and age group, “compatibility with hobbies” and “availability of work” were most common among men aged 29 and under; “family home or family circumstances” and “availability of daily amenities such as shopping, medical care, and public facilities” were most common among women in their 40s and 50s; “public safety and security” was most common among women aged 50 and over; “nature and surrounding environment,”and “Atmosphere of the town or neighborhood” were highly prioritized by men and women in their 60s and older. This suggests that priorities vary depending on age and life stage (Figure 13).
Attitudes toward work, learning, and money
"Travel" ranked first among the categories where people are most selective about spending their money. While many categories saw a decrease compared to the previous year due to factors such as rising prices, spending on "travel" increased, as did investments in the future, such as "investments and asset management" and "tuition and course fees for self-improvement."
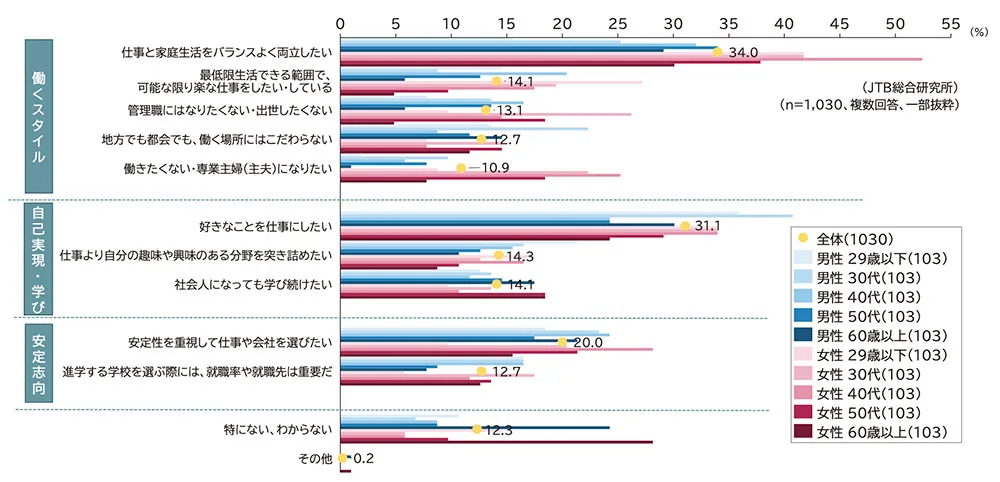
Regarding work and learning, the top responses overall were: “I want to achieve a good balance between work and family life (34.0%),” “I want to turn my hobbies into a career (31.1%),” and “I want to choose a job or company that prioritizes stability (20.0%).”When broken down by gender and age group: men aged 29 and under cited “I want to pursue my hobbies or areas of interest rather than work (21.4%),” while women aged 29 and under cited “I want to do—or am doing—work that is as easy as possible while still earning enough to live on (27.2%).”for women in their 30s, “I don’t want to become a manager or advance in my career (26.2%)”; and for women in their 40s, “I want to maintain a good balance between work and family life (52.4%)” and “I don’t want to work; I want to be a full-time homemaker (25.2%)” were the highest responses, respectively(Figure 14).
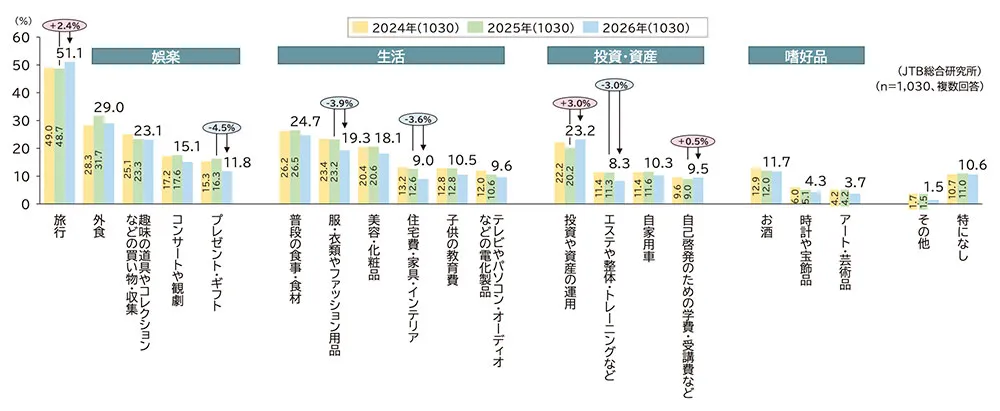
Regarding areas where people are particular about spending money, the top three were “travel (51.1%),” “eating out (29.0%),” and “daily meals and groceries (24.7%).”Compared to the previous year, “travel” increased by 2.4 percentage points, “investments and asset management” by 3.0 percentage points, and “tuition and course fees for self-improvement” by 0.5 percentage points, while all other items decreased.The categories with the largest decreases were “gifts,” “clothing and fashion items,” “housing costs, furniture, and interior decor,” and “beauty treatments, massage, and fitness training.”While overall consumption remains restrained due to factors such as rising prices, it appears that investment, asset management, and learning for future reskilling are gaining attention, likely influenced by the expansion of NISA (Figure 15).
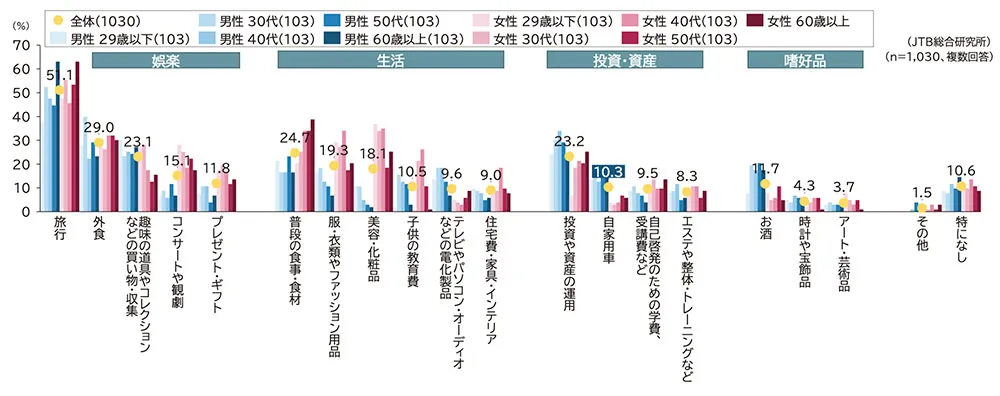
When broken down by gender and age group, "travel" was the top category for men and women aged 60 and older; "concerts and theater" and "beauty and cosmetics" were the top categories for women aged 29 and under and those in their 30s; and "investment and asset management" was the top category for men in their 30s to 50s.Regarding “concerts and theater performances” in particular, while 6.8% of men aged 29 and under were interested, 28.2% of women in the same age group were interested, indicating a significant difference even within the same age group (Figure 16).
Attitudes and Values Regarding Travel
Shift from Overseas to Domestic Travel? The "core group of overseas travelers" (those who travel abroad at least once every two to three years) has halved compared to pre-pandemic levels
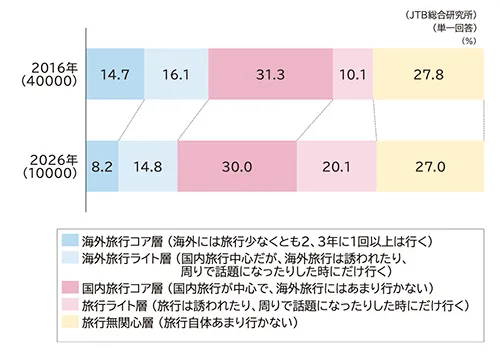
According to the Japan National Tourism Organization (JNTO), the estimated number of Japanese travelers departing the country in 2025 is 14,731,500 (a 13.3% increase from the previous year). While the number is recovering, it remains at around 70% of pre-pandemic levels.In this survey, when asked about the frequency of leisure travel, the “core overseas travelers (those who travel abroad for leisure at least once a year) + (those who travel abroad for leisure at least once every 2–three years) accounted for 8.2% of the total, halving compared to a survey conducted 10 years ago*3. Conversely, the proportion of the “light travelers (who rarely take overseas leisure trips but will travel domestically if given the opportunity)” increased. It is thought that the COVID-19 pandemic disrupted the habit of overseas travel, leading to a shift toward domestic travel (Figure 17).
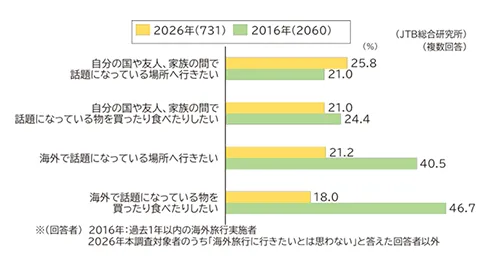
When comparing the results of this survey to previous findings regarding the types of overseas travel people would like to experience, there was a significant decline in “overseas-oriented” preferences, such as “wanting to visit places that are trending overseas” or “wanting to buy or eat items that are trending overseas.”Furthermore, when comparing “wanting to visit places that are trending” (experience-oriented) versus “wanting to buy or eat items that are trending” (product-oriented), by 2026, “experience-oriented” preferences will surpass “product-oriented” ones for both domestic and international travel.It appears likely that people have come to prefer topics trending on familiar social media platforms over information about overseas destinations conveyed through foreign media (Figure 18).
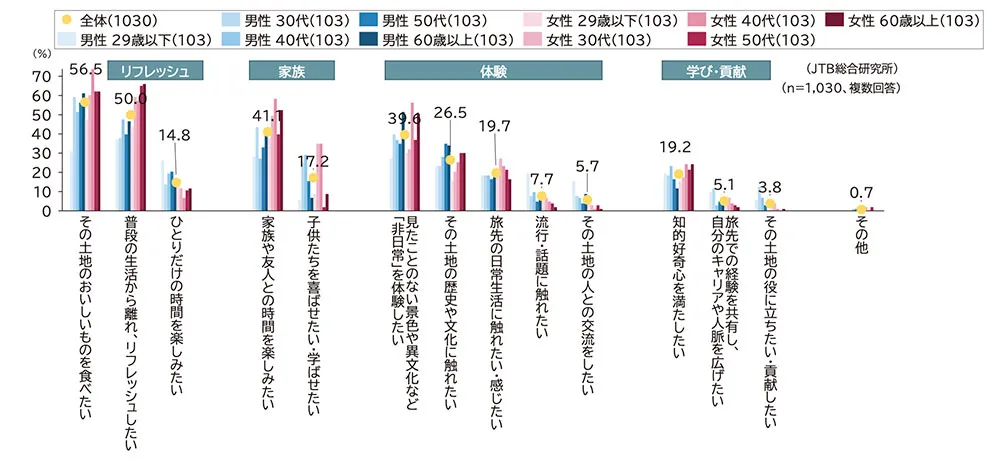
What people seek from travel—such as “food,” “rejuvenation,” and “spending time with family and friends”—varies by age group and life stage. Regarding behavior while traveling, “risk-averse” behavior focused on avoiding anxiety and prioritizing safety is more common among relatively younger age groups, while behavior that embraces unexpected events, troubles, and the unknown tends to be more prevalent among older age groups.
Overall, the top things people seek from travel were “eating delicious local food (56.5%),” “getting away from daily life to refresh (50.0%),” and “enjoying time with family and friends (41.1%).”When broken down by gender and age group, men aged 29 and under had the highest rates across all demographics for “wanting to enjoy time alone (26.2%)” and “wanting to experience trends and hot topics (19.4%).”Additionally, among women in their 40s, “Wanting to eat delicious local food (73.8%)” and “Wanting to experience the extraordinary, such as unfamiliar scenery and different cultures (56.3%)” were high. Furthermore, since many are likely raising children, “Wanting to enjoy time with family and friends (58.3%)” and"Want to make my children happy or help them learn (35.0%)" also scored high. Furthermore, among women in their 50s and older, "Want to get away from daily life and refresh myself" was particularly high, demonstrating that what people seek from travel varies by age and life stage (Chart 19).
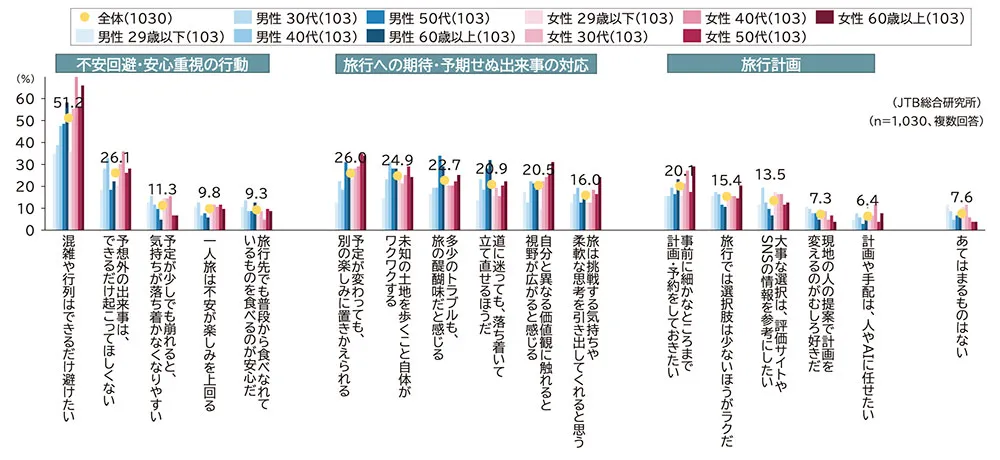
Finally, we asked about behaviors, feelings, and attitudes during travel. “Wanting to avoid crowds and lines as much as possible (51.2%)” and “Wanting to avoid unexpected events as much as possible (26.1%)”—so-called “risk-averse behaviors” that prioritize avoiding anxiety and seeking peace of mind—ranked high.Following these were responses such as “Even if plans change, I can find another way to enjoy myself (26.0%)” and “Just walking through unfamiliar places is exciting (24.9%)”,and “I feel that minor troubles are part of the thrill of travel (22.7%)”—behaviors that embrace unexpected events, troubles, and the unknown while traveling.
When broken down by gender and age group, “I tend to feel unsettled if my plans are disrupted even slightly” and “Anxiety outweighs the enjoyment of solo travel” were higher among relatively younger age groups, while “Even if plans change, I can find another way to enjoy myself,”and “Walking through unfamiliar places is exciting in itself” and “I feel that minor troubles are part of the thrill of travel” tended to be higher among older age groups.Additionally, among women in their 40s, “I want to avoid crowds and lines (69.9%)” and “I want to leave planning and arrangements to others or AI (11.7%)” were higher than in any other demographic group, suggesting needs specific to the child-rearing generation.Just as in daily life, behavior prioritizing “menta-pa” is spreading among travelers, particularly among younger generations (Figure 20).
Summary
This survey revealed the growing prevalence of “time-saving” behaviors in daily life, the expanding trend toward “mental well-being,” and a value system that prioritizes “a stress-free life” as the ideal way of living. This mindset of prioritizing peace of mind extends to travel as well.A growing desire for security—centered on the younger generation—characterized by a reluctance to “fail” or a desire to “avoid the unexpected,” is reshaping the nature of travel.
"Time-saving" Becoming Part of Daily Life and the "Mental Peace" Mindset That Follows
“Time-efficiency” (Taipa) behaviors, which prioritize time efficiency, are becoming ingrained in daily life, particularly among younger generations. Trends such as “I don’t want to waste time on unnecessary things” and “I dislike time spent doing nothing” are particularly pronounced. Furthermore, beyond this, a “mental peace” (Menpa) mindset—a desire to avoid mental stress and failure—is spreading.While the belief that “failure leads to future learning” is strong among those in their 50s and older, it is low among those aged 29 and under, revealing a significant gap.
Changes are also evident in how information is gathered. While “word of mouth from family and friends” remains the top source, it is on a downward trend, while “anonymous social media posts by strangers” and “AI-generated answers” are surging. To avoid failure, behaviors aimed at efficiently gathering a wide range of information are becoming widespread.
The ideal lifestyle is “a life free of stress,” a comfortable place to be, and the right distance from others
Amid a two-year consecutive decline in life satisfaction, “being stress-free” ranked as the top condition for a comfortable living space. Among younger generations in particular, responses such as “not having to push myself” and “being able to pursue only what I love” were prominent, clearly reflecting a strong desire to live peacefully without overexertion.
Regarding the ideal lifestyle, “financial security” and “spending time at a leisurely pace without being rushed” ranked high, while regarding neighborhood interactions, the majority of respondents felt that “a simple greeting is sufficient” or that such interactions are “necessary to avoid trouble.”Regarding work styles, while about 70% of respondents wish to work from home at least one day a week, only about 30% are actually able to do so, revealing a gap between ideal and actual lifestyles.
On the other hand, “travel” ranked first among the areas where people are willing to spend money selectively.While many spending categories decreased compared to the previous year due to factors such as rising prices, spending on “travel,” as well as “investments and asset management” and “tuition and course fees for self-improvement,” actually increased. This suggests that while people seek to avoid stress in their daily lives, they maintain a proactive attitude toward activities that bring emotional fulfillment or contribute to their future.
"Menpa" Behavior While Traveling—Is the View That "Troubles Are Part of the Fun of Travel" Changing?
The core demographic for overseas travel has halved compared to pre-pandemic levels, and there is a growing shift toward domestic travel. The top priorities for travelers are “local cuisine,” “rejuvenation,” and “time with family and friends,” indicating a desire for trips that offer relief from daily stress and a sense of security and enjoyment.
Regarding behavior while traveling, the tendency to avoid anxiety and prioritize peace of mind—such as “wanting to avoid crowds and lines” and “hoping no unexpected events occur”—is higher among younger age groups.On the other hand, older age groups are more likely to hold the attitude that “even if plans change, they can be replaced with other pleasures” or that “minor troubles are part of the charm of travel,” revealing a clear difference in travel attitudes.
In these rapidly changing times, the “Menpa” mindset—which prioritizes mental peace by avoiding psychological stress as much as possible—is expected to grow even more widespread. The key to the future of the travel industry will lie in offering diverse travel options tailored to different age groups and life stages, as well as creating experiences that balance a sense of security with a spirit of adventure.