Announcement of “Travel Trends for the 2026 Golden Week (April 25–May 7)”
This report is based on estimates derived from a survey conducted by the JTB Group, as well as various economic trends, industry trends, transportation and tourism-related data, accommodation booking status, and various opinion surveys. The survey has been conducted continuously since 1969. (Our company is responsible for the research and analysis in this report.)
Key Findings
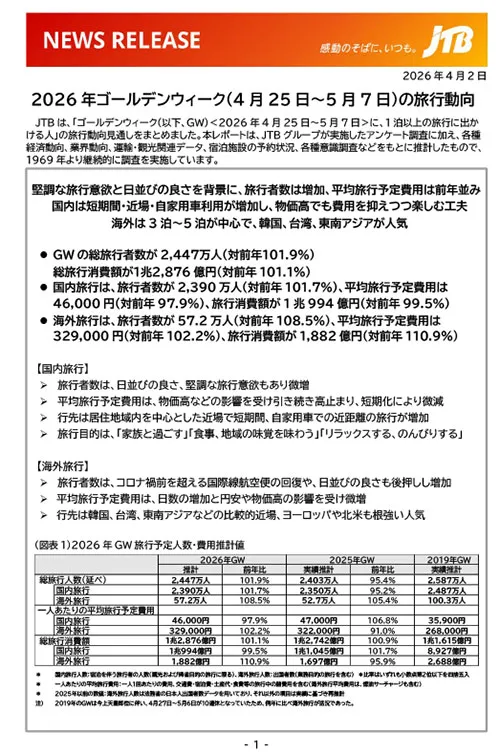
- Driven by strong travel demand and favorable calendar dates, the number of travelers has increased, while the average planned travel budget remains on par with last year. For domestic travel, there has been an increase in short trips, nearby destinations, and travel by private car, with travelers finding ways to enjoy themselves while keeping costs down despite rising prices. For overseas travel, trips of 3 to 5 nights are the norm, with South Korea, Taiwan, and Southeast Asia proving popular.
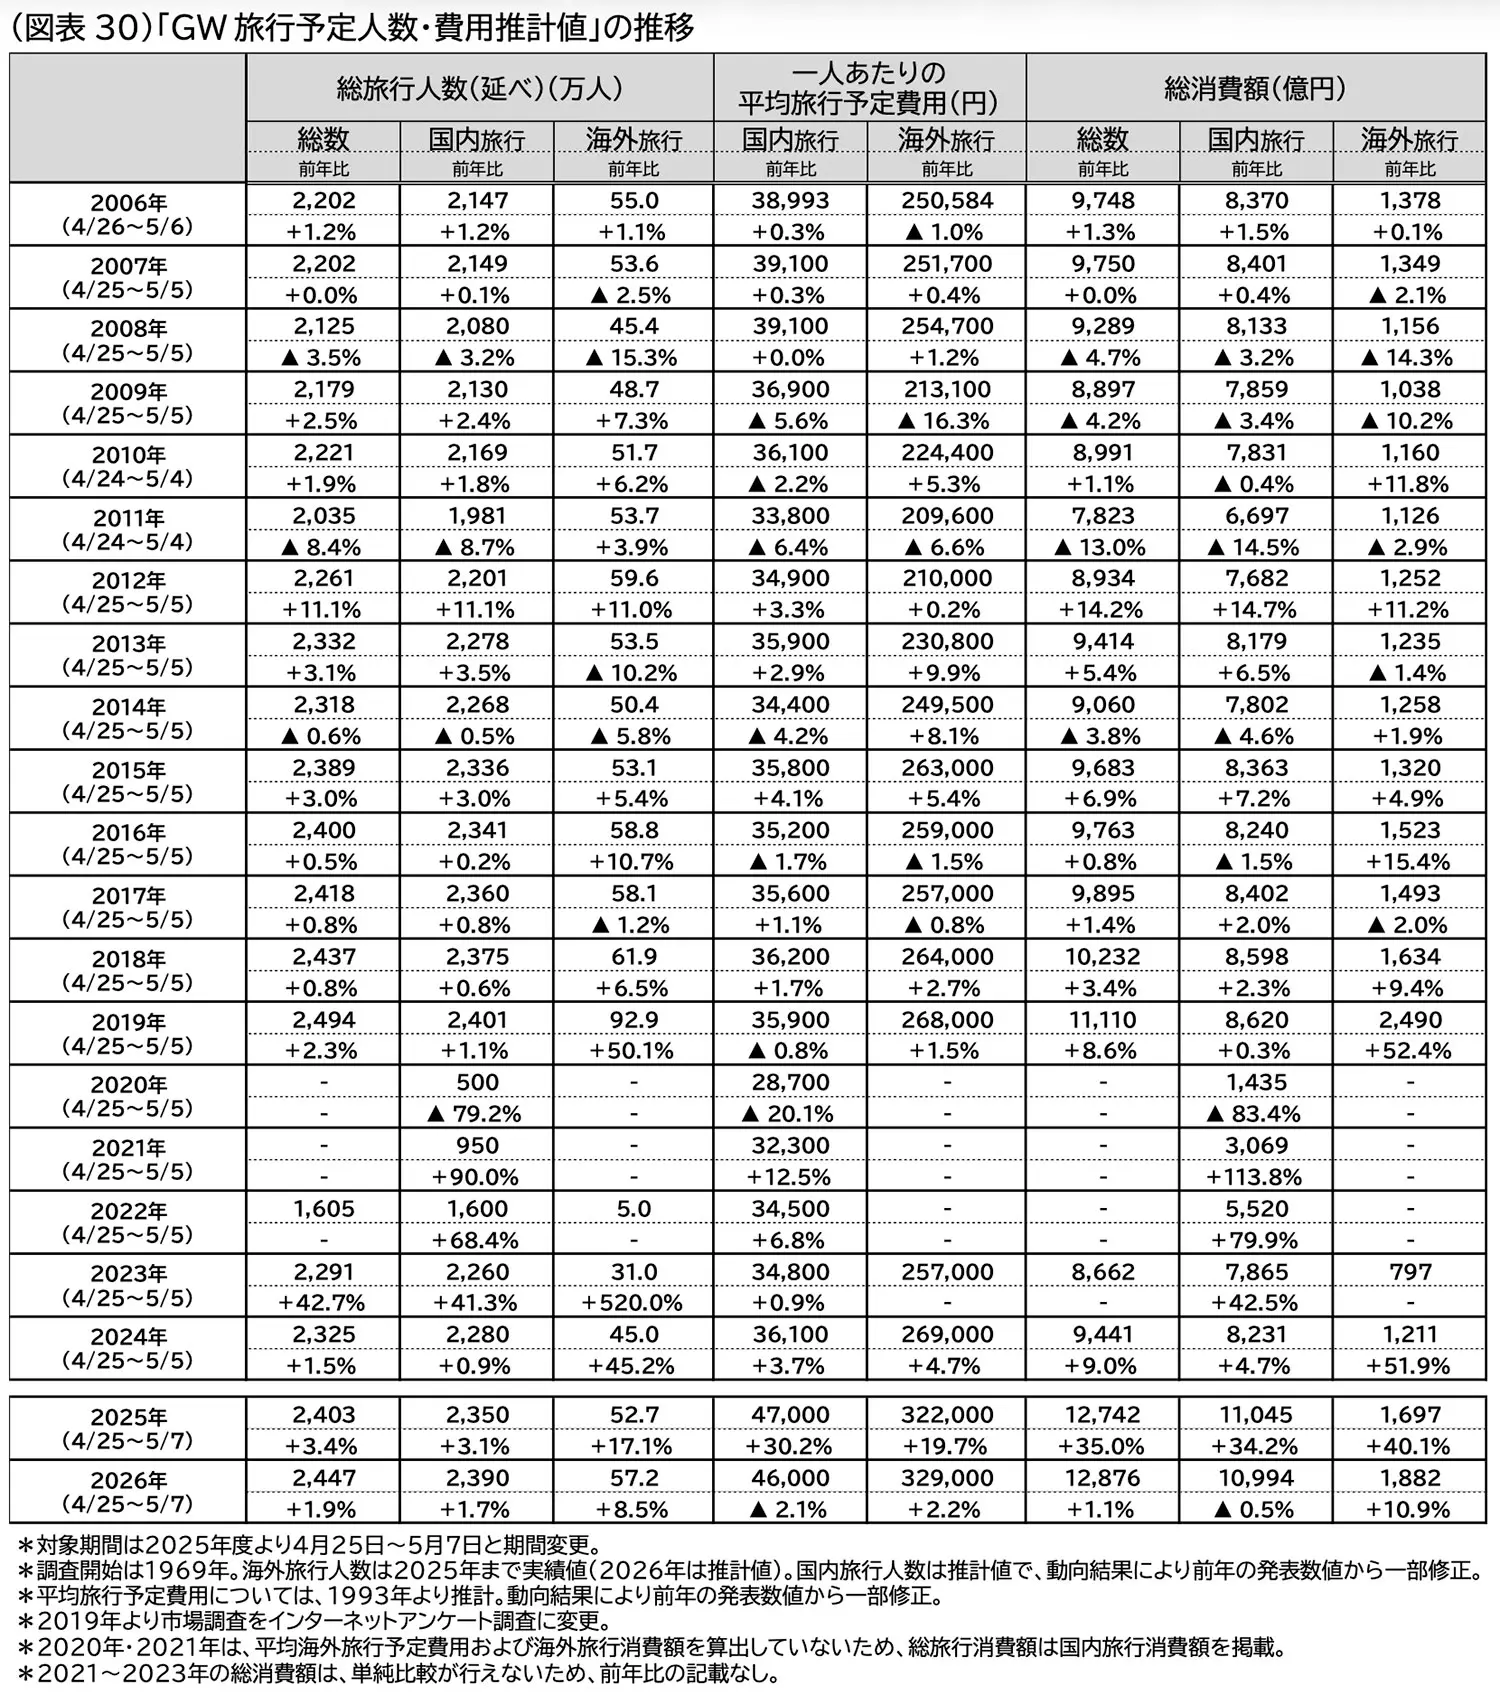
Total number of travelers during Golden Week was 24.47 million (101.9% of the previous year), and total travel spending was 1.2876 trillion yen (101.1% of the previous year) For domestic travel, the number of travelers was 23.9 million (101.7% of the previous year), the average planned travel expenditure was 46,000 yen (97.9% of the previous year), and travel spending totaled 1.0994 trillion yen (99.5% of the previous year). For overseas travel, the number of travelers was 572,000 (108.5% of the previous year), the average planned travel expense was 329,000 yen (102.2% of the previous year), and travel spending totaled 188.2 billion yen (110.9% of the previous year).
- Domestic Travel
The number of travelers saw a slight increase, driven by favorable calendar dates and strong travel demand. Average planned travel expenses remained high due to factors such as rising prices but declined slightly as trips became shorter. Destinations were primarily nearby locations within travelers’ home regions for short stays, with an increase in short-distance trips by private car. Travel purposes included:“spending time with family,” “enjoying meals and local cuisine,” and “relaxing and taking it easy.”
- Travel Abroad
The number of travelers increased, driven by the recovery of international flights—which have now surpassed pre-pandemic levels—as well as favorable calendar timing. Average planned travel expenses rose slightly, influenced by longer trips, a weaker yen, and rising prices. Popular destinations include relatively nearby locations such as South Korea, Taiwan, and Southeast Asia, while Europe and North America also remain consistently popular.
1This Year's Golden Week Calendar and Travel Trends

According to the 2026 Golden Week calendar, there will be a five-day holiday stretch from May 2 (Sat) to May 6 (Wed, substitute holiday).If you take Thursday, April 30, and Friday, May 1, off, you’ll have an 8-day holiday; if you take Thursday, May 7, and Friday, May 8, off, you’ll have a 9-day holiday; and if you string these days together, you can have 12 or more consecutive days off. This calendar makes it easy to take extended vacations depending on how you combine your days off.Here, we conducted a survey to gather detailed information on travel plans—including trips to visit family—for the 2026 Golden Week period (April 25–May 7).
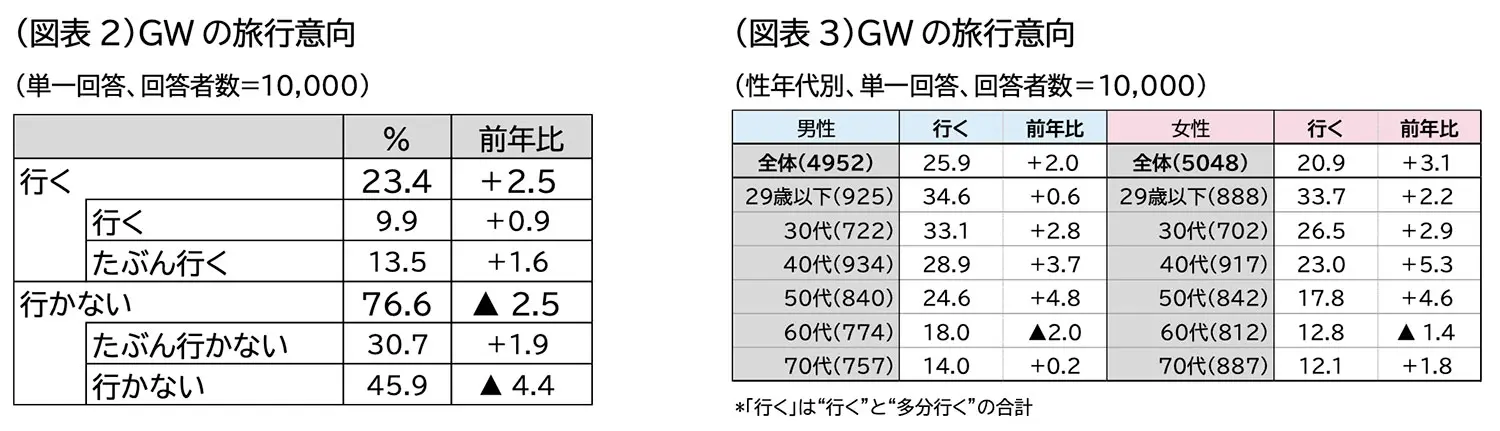
Regarding travel during the Golden Week period, 23.4% of respondents answered that they “will go” (combining “will go” and “probably will go”), marking a 2.5-point increase compared to the previous year (April 25–May 7, 2025) (Figure 2).
By gender and age group, the highest rates were among “men aged 29 and under (34.6%),” “women aged 29 and under (33.7%),” and “men in their 30s (33.1%),” in that order, with all exceeding 30%.Furthermore, the desire to travel increased compared to the previous year across all age groups except for men and women in their 60s, with particularly high growth rates among men and women in their 40s and 50s (Figure 3).
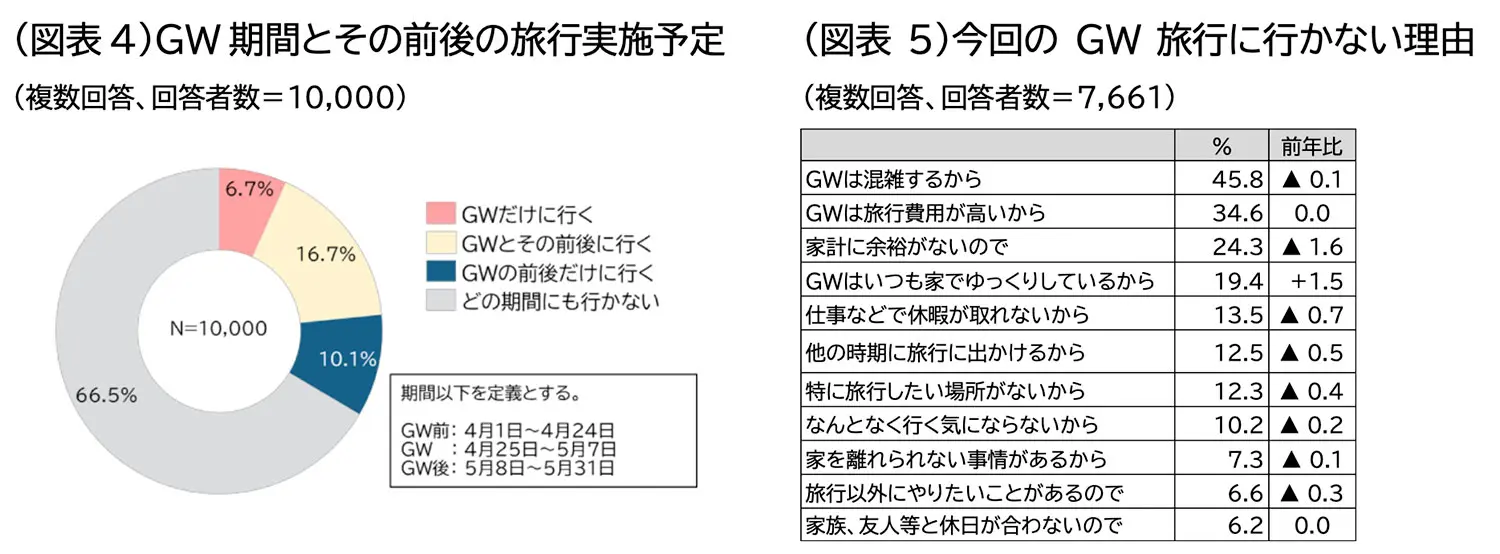
Furthermore, when asked about travel plans for the period from April 1 to 24 (before Golden Week) or from May 8 to 31 (after Golden Week), 6.7% said they would “travel only during Golden Week,” while 16.7% said they would “travel during Golden Week and the days before and after.”and “I will travel only before and after Golden Week” at 10.1%, indicating that the number of people traveling “only before and after Golden Week” exceeded those traveling “only during Golden Week.” It is believed that the trend of travel dates becoming more dispersed continues, as more people take time off before and after the long holiday due to more flexible work arrangements (Chart 4).
The top reasons for not traveling were, in order: “Golden Week is too crowded (45.8%),” “Travel costs are too high during Golden Week (34.6%),” and “I don’t have enough disposable income (24.3%).”Additionally, “I always relax at home during Golden Week (19.4%)” was the only option among all choices that saw an increase compared to the previous year. It appears that some people are choosing to spend their holidays in a more relaxed manner, without pushing themselves too hard, in light of the crowds and rising costs (Figure 5).
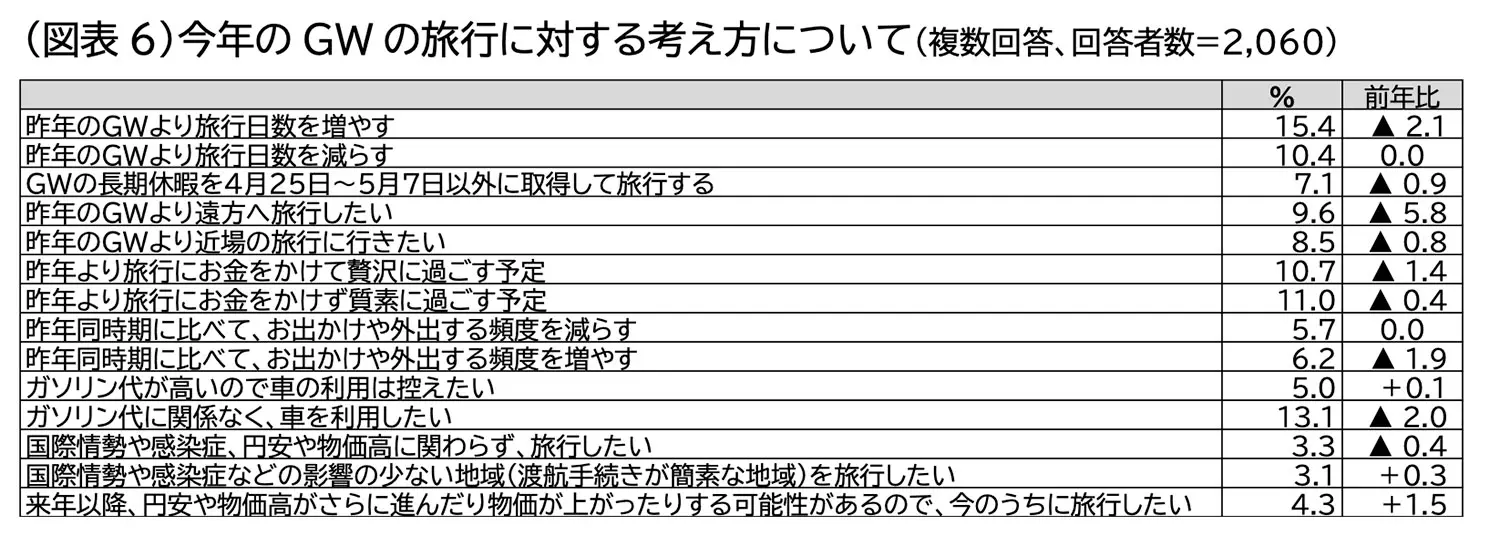
We asked the 2,060 respondents in this survey who said they would be traveling during Golden Week about their attitudes toward travel this Golden Week.Regarding travel destinations, the percentage of respondents who said they “want to travel farther than during last year’s Golden Week (9.6%)” decreased by 5.8 percentage points compared to the previous year, far exceeding the 0.8-point decrease in those who “want to take a trip closer to home than during last year’s Golden Week (8.5%)”.Additionally, the percentage of respondents who said, “I plan to spend more money on travel than last year and have a luxurious time (10.7%)” decreased by 1.4 percentage points, falling below the percentage of those who said, “I plan to spend less money on travel than last year and have a modest time (11.0%).”Furthermore, the percentage of respondents who said they would “increase” the number of travel days or the frequency of trips is on a downward trend. Regarding gasoline, the percentage of those who said, “I want to use a car regardless of gas prices (13.1%)” decreased by 2.0 percentage points.
Furthermore, the percentage of respondents who said, “I want to travel regardless of the international situation, infectious diseases, a weak yen, or high prices (3.3%)” decreased by 0.4 percentage points, while those who said, “I want to travel to regions less affected by the international situation or infectious diseases (3.1%)” increased by 0.3 percentage points,while “I want to travel now because there is a possibility that the yen will weaken further, inflation will worsen, or prices will rise next year or beyond (4.3%)” increased by 1.5 percentage points. Amid this ongoing uncertainty, the presence of a group that believes in “traveling while they can” is evident (Figure 6).
2Trends in Domestic Travel
The number of domestic travelers was 23.9 million (101.7% of the previous year’s figure), the average planned travel expenditure was 46,000 yen (97.9% of the previous year’s figure), and total domestic travel spending was 1,099.4 billion yen (99.5% of the previous year’s figure).Although factors such as high prices have had an impact, favorable calendar timing has provided a boost, and travel demand is viewed as robust, with the number of travelers showing a slight year-over-year increase. While travel expenses remain high, we forecast a slight decrease due to shorter travel durations (Figure 1).
In a survey regarding this year’s Golden Week travel, we analyzed the travel trends of the 1,941 respondents (out of 2,060 total) who indicated “within Japan” as their destination.
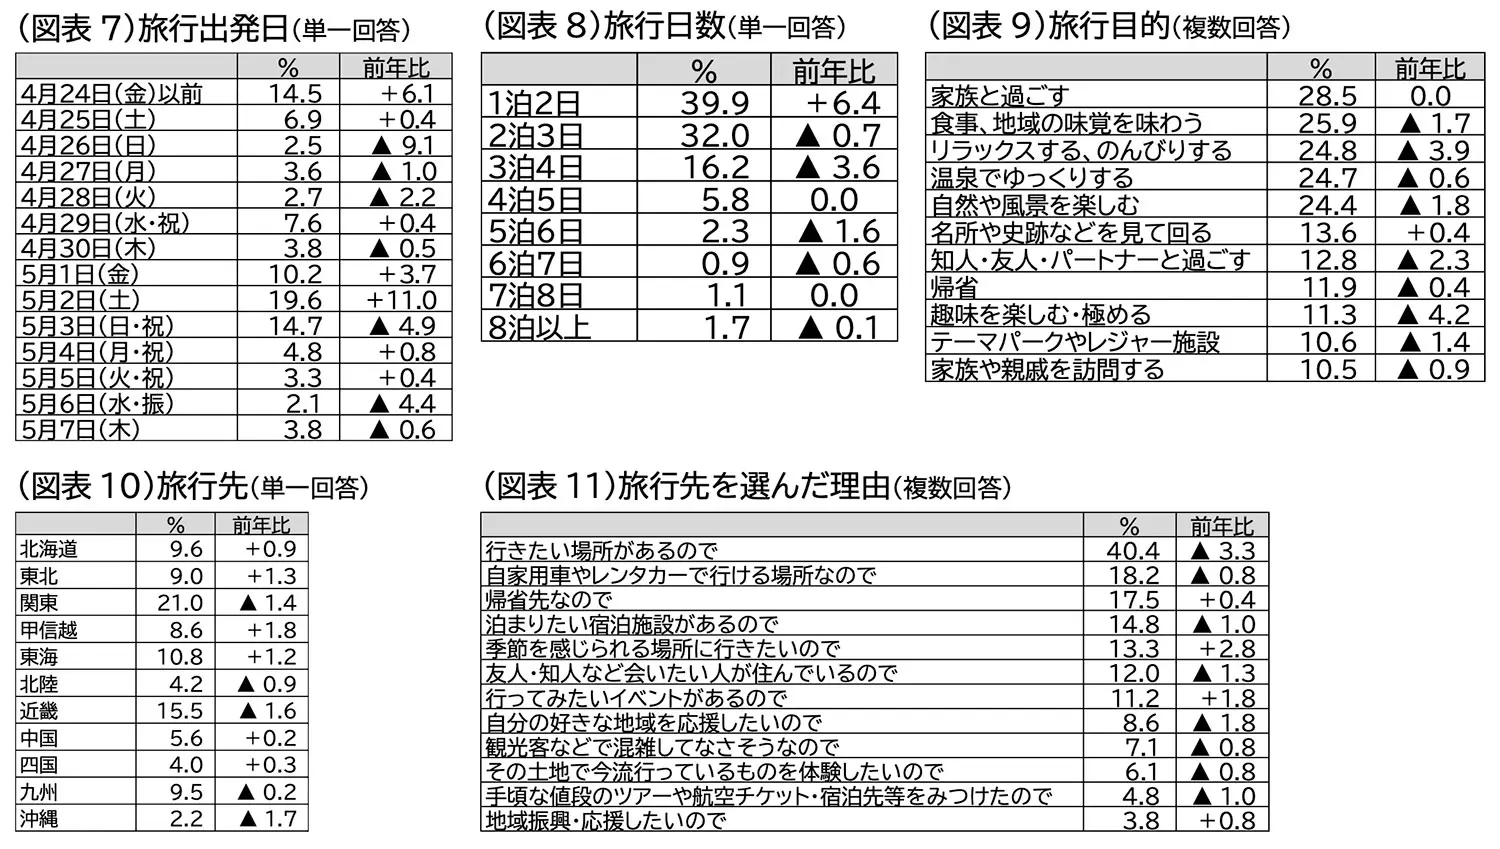
Travel Departure Date: The peak departure date was “May 2 (Sat) (19.6%),” followed by “May 3 (Sun, holiday) (14.7%),”“on or before April 24 (Fri) (14.5%).” While the peak is centered on the latter half of the five-day holiday, early departures on or before April 24 (Fri) account for a significant proportion, suggesting that travelers are attempting to avoid crowds (Figure 7).
Duration of Trip: Overall, “1 night, 2 days (39.9%)” was the most common, increasing by 6.4 percentage points from the previous year.This was followed by “2 nights, 3 days (32.0%)”, which decreased by 0.7 percentage points, and “3 nights, 4 days (16.2%)”, which decreased by 3.6 percentage points; none of the trips lasting two or more nights saw an increase, resulting in an overall decrease of 6.5 percentage points (Figure 8).
Purpose of travel: The most common purpose was “spending time with family” at 28.5%.This was followed by “enjoying meals and local cuisine (25.9%)” and “relaxing and taking it easy (24.8%).” It appears there is a growing tendency to prioritize the time spent with travel companions over sightseeing and experiences at the destination (Figure 9).
Travel Destinations: “Kanto (21.0%)” was the most popular choice, though it decreased by 1.4 percentage points from the previous year; “Kinki (15.5%),” which ranked second, also decreased by 1.6 percentage points.In terms of growth rates, “Koshinetsu (8.6%)” increased by 1.8 percentage points, “Tohoku (9.0%)” by 1.3 percentage points, and “Tokai (10.8%)” by 1.2 percentage points (Figure 10).
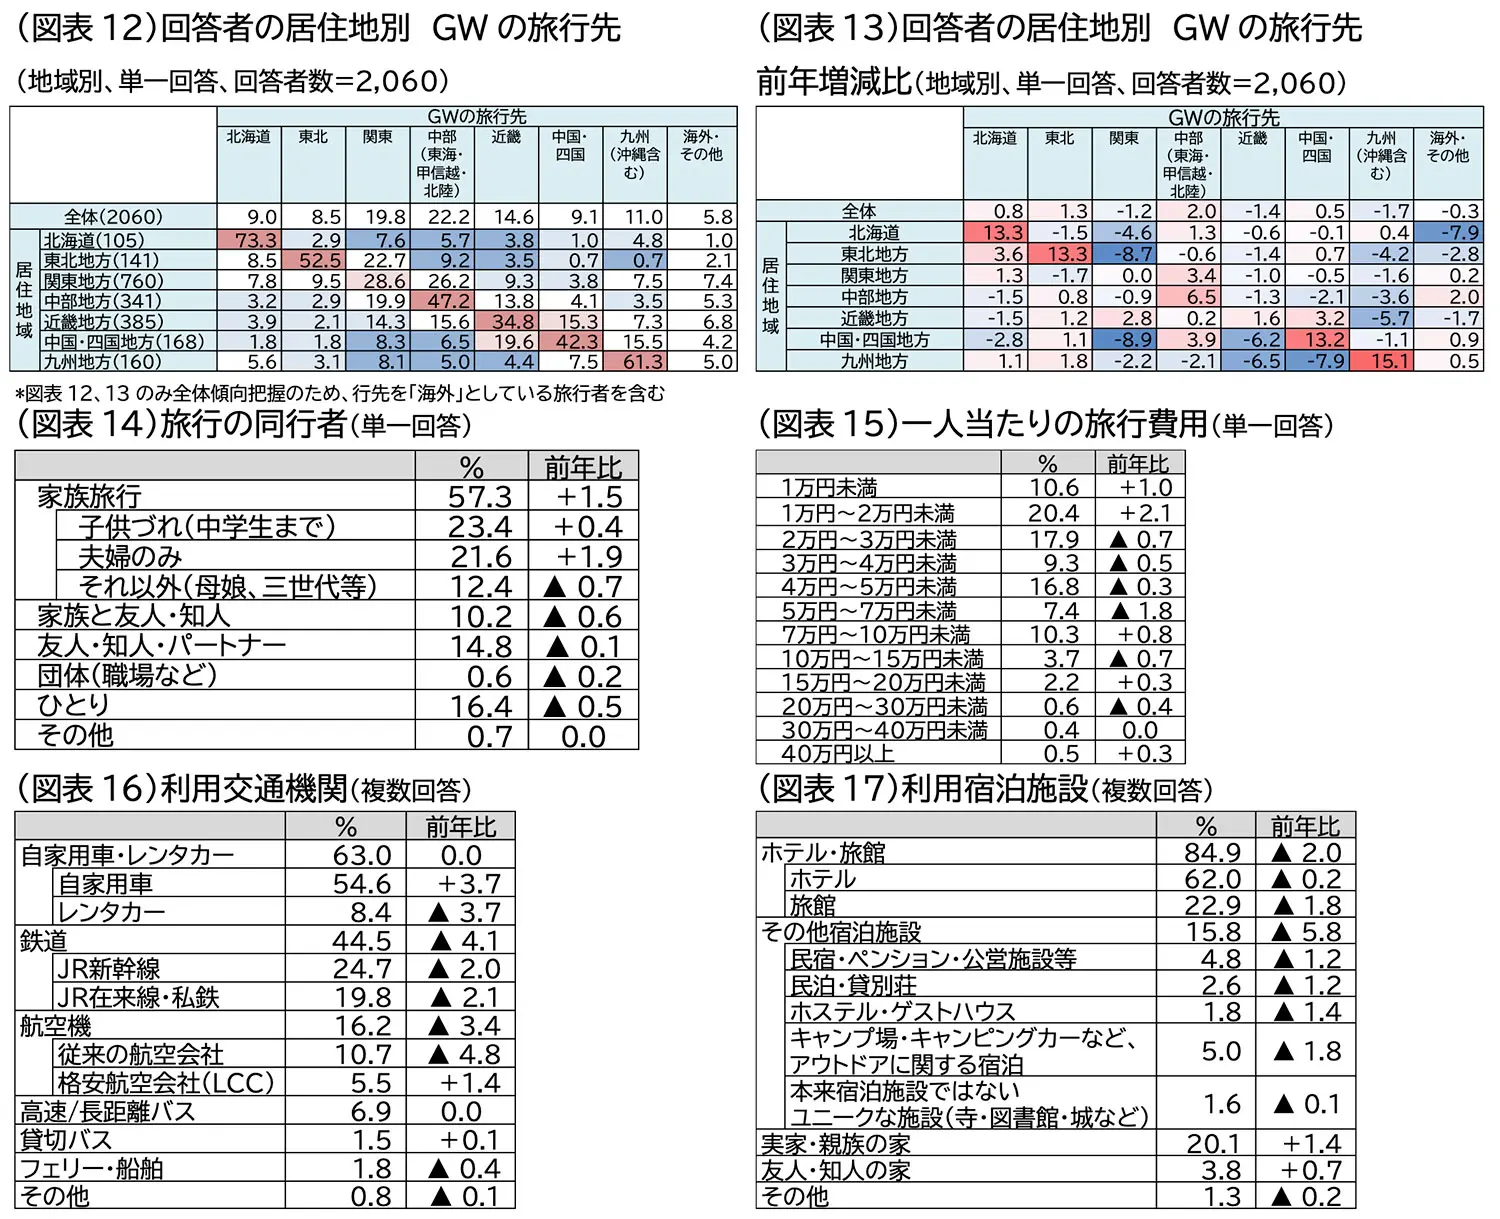
The most common reason for choosing a particular travel destination was “There is a place I want to visit (40.4%),” followed by “It is a place I can reach by private car or rental car (18.2%),” and “It is my hometown (17.5%)” (Figure 11).Looking at travel destinations by region of residence, the proportion of “intra-regional travel”—where the travel destination is in the same region as the place of residence—was highest in “Hokkaido” at 73.3%, followed by “Kyushu (61.3%)” and “Tohoku (52.5%)”. In contrast, “Kanto” had the lowest rate at 28.6%(Figure 12). Furthermore, compared to the previous year, the proportion of intra-regional travel increased in all regions except the Kanto region. Since the previous year saw a decrease in all regions except the Kinki region—where the “2025 Osaka-Kansai World Expo” was being held—it can be said that the upward trend in intra-regional travel has strengthened even further this year (Figure 13).
Travel companions: “Family trips with children (up to junior high school age) (23.4%)” were the most common, increasing by 0.4 percentage points from the previous year, followed by “couples only (21.6%),” which increased by 1.9 percentage points.While family travel increased by a total of 1.5 percentage points, all other categories saw a decrease (Figure 14).
Average planned travel expenses per person: “10,000 to less than 20,000 yen (20.4%)” was the most common response, up 2.1 percentage points from the previous year.This was followed by “20,000 yen to less than 30,000 yen (17.9%)” and “40,000 yen to less than 50,000 yen (16.8%),” though both categories saw a decrease from the previous year. The proportion of travelers spending 20,000 yen or less has increased, indicating a growing trend toward keeping travel expenses down (Figure 15).
Means of transportation: “Private car (54.6%)” was the most common, followed by “JR Shinkansen (24.7%)” and “JR conventional lines and private railways (19.8%)”.While usage of “JR Shinkansen” and “JR conventional lines and private railways” declined, “private cars” increased by 3.7 percentage points and “low-cost carriers (LCCs) (5.5%)” increased by 1.4 percentage points.“Express/long-distance buses” and “chartered buses” also remained at the same level as the previous year, indicating a trend toward choosing transportation options that help keep costs down (Figure 16).
Accommodations: “Hotels (62.0%)” were the most common choice, followed by “Ryokan (22.9%),” though both saw a decline.While all types of accommodations saw a decrease compared to the previous year, “Parents’ or relatives’ homes (20.1%)” increased by 1.4 percentage points, and “Friends’ or acquaintances’ homes (3.8%)” rose by 0.7 percentage points (Figure 17).
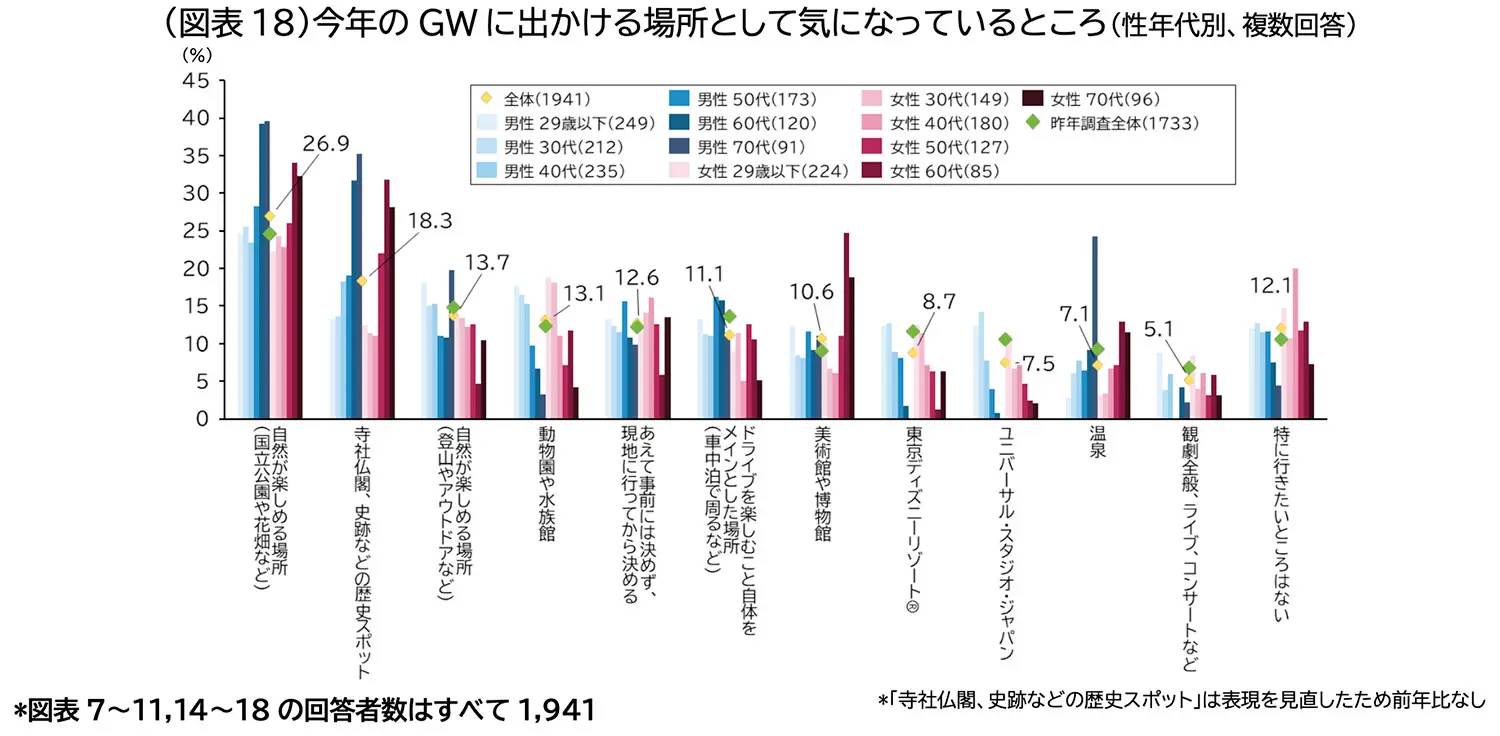
Places of interest to visit: “Places to enjoy nature (such as national parks and flower fields) (26.9%)” were the most popular, followed by “historical sites such as temples, shrines, and historic sites (18.3%)” and “places to enjoy nature (such as mountain climbing and outdoor activities) (13.7%)”(Figure 18).
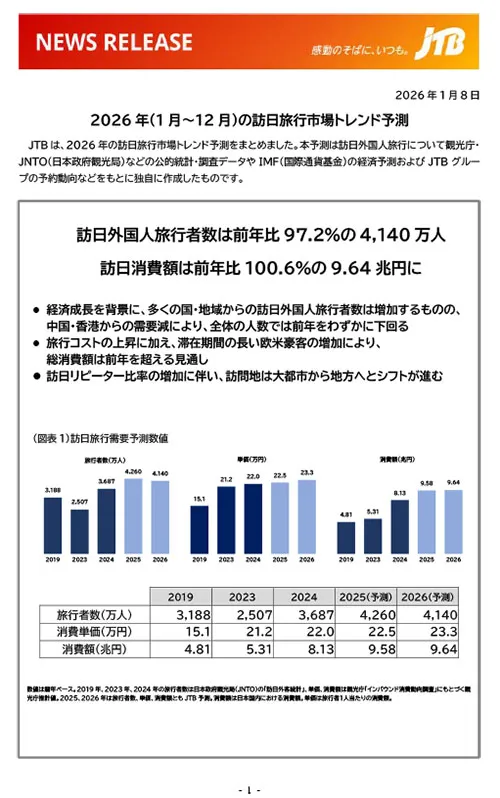
Popular domestic travel destinations according to JTB include theme parks such as Tokyo (including Tokyo Disney Resort®) and the Kansai region (including Universal Studios Japan). Long-distance destinations requiring travel by JR or airplane, such as Kyushu and Okinawa, are also performing well.
3Trends in Overseas Travel
The number of outbound travelers is estimated at 572,000 (108.5% of the previous year’s figure). Boosted by the strong inbound tourism market to Japan, international flight capacity has exceeded pre-pandemic levels. Additionally, favorable calendar timing and increased travel enthusiasm are expected to drive the figure above last year’s level.The average planned travel expenditure is 329,000 yen (102.2% of the previous year), and total overseas travel spending is 188.2 billion yen (110.9% of the previous year). Specific trends are described below.
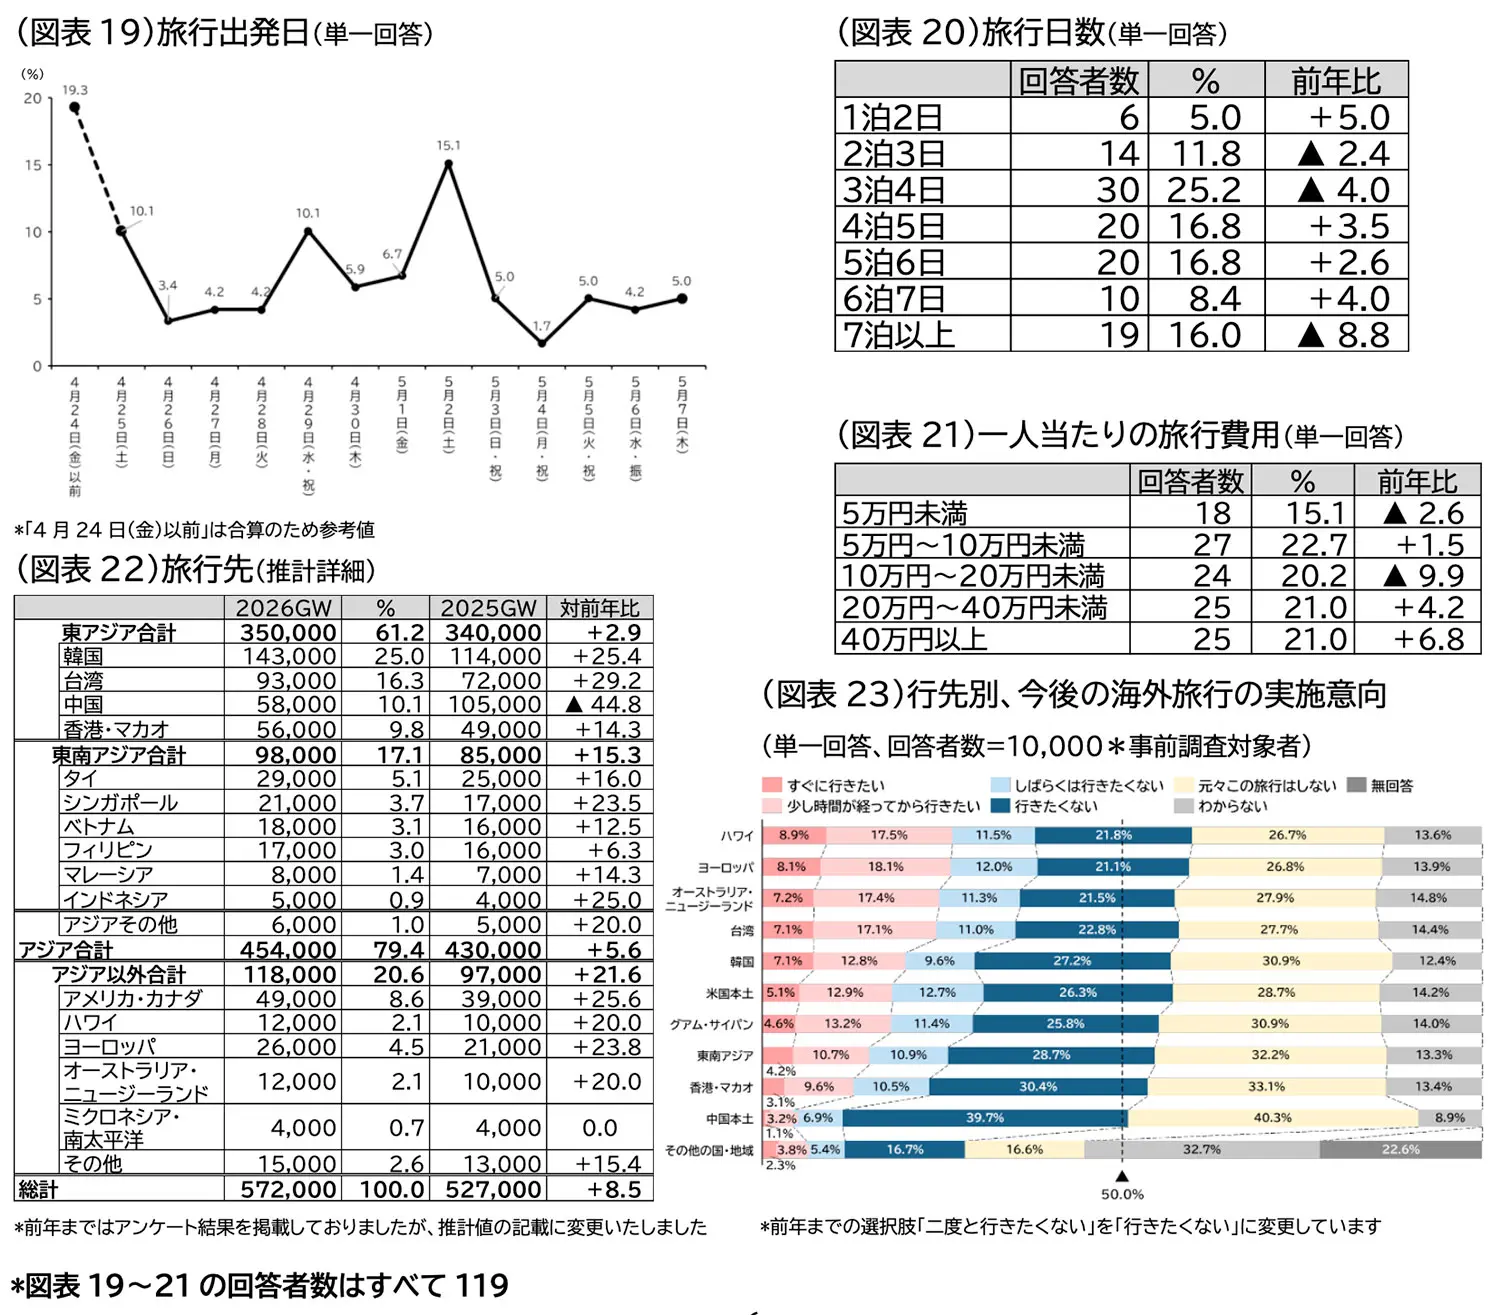
Of the 2,060 respondents in this survey, 119 (5.8%) indicated that their Golden Week travel destination this year would be “overseas.” The peak departure date was “on or before Friday, April 24 (19.3%),”followed by “May 2 (Sat) (15.1%)”, “April 25 (Sat) (10.1%)”, and “April 29 (Wed, holiday) (10.1%)”, which were tied (Figure 19).While “3 nights/4 days (25.2%)” was the most common trip duration, it decreased by 4.0 percentage points from the previous year; next was “4 nights/5 days (16.8%),” which increased by 3.5 percentage points; and “5 nights/6 days (16.8%),” which tied for second place, increased by 2.6 percentage points.Compared to the previous year, trips lasting 4 to 6 nights have increased, partly due to the ease of taking consecutive days off. Meanwhile, “1-night trips (5.0%)”—which accounted for 0% last year—also rose by 5 percentage points (Figure 20). Additionally, the most common travel budget was “50,000 yen to less than 100,000 yen (22.7%),” up 1.5 percentage points from the previous year,followed by “400,000 yen or more (21.0%),” which rose by 6.8 percentage points from the previous year, while “200,000 yen to less than 400,000 yen (21.0%),” which had the same percentage as the previous year, saw a 4.2-point increase (Figure 21).
Estimates were made for travel destinations by country and region. From the top, “South Korea (25.0%)” was the most popular, followed by “Taiwan (16.3%).” Furthermore, Southeast Asia as a whole accounted for 17.5% of the total, while Asia as a whole accounted for 79.0%.On the other hand, looking at growth rates, distant destinations such as “the United States and Canada (North America),” “Europe,” and “Australia and New Zealand” also showed double-digit growth, indicating their enduring popularity (Figure 22).
JTB’s most popular overseas travel destinations include Hawaii, Taiwan, South Korea, and Guam, as well as the U.S. West Coast, Australia, and France.
We asked the survey respondents—including those who were not traveling during this Golden Week—about their intentions regarding future overseas travel.When looking at the timing of overseas travel by destination, “Hawaii (8.9%)” had the highest percentage of respondents who said they “want to go right away,” followed by “Europe (8.1%)” and “Australia and New Zealand (7.2%)” (Figure 23).
4The Economic Environment and Consumer Attitudes Surrounding Travel and Leisure Spending
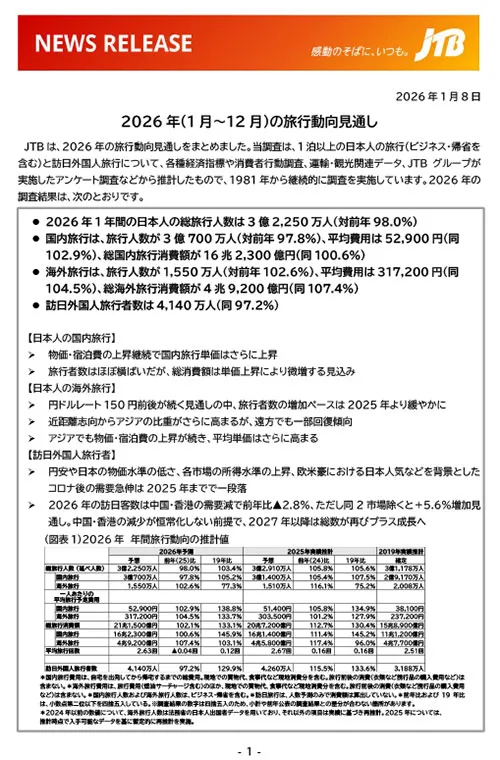
Although the Japanese economy continues to show signs of a gradual recovery, significant risks stemming from the external environment—such as rising crude oil prices due to escalating tensions in the Middle East and uncertainty surrounding U.S. trade policy—remain, and the outlook remains uncertain.The Nikkei Stock Average, after briefly reaching the 58,000-yen level in February 2026, has been hovering around 52,000 yen in March, indicating market volatility.
According to the government’s monthly economic report, the assessment of the economic trend for February 2026 states: “The economy is recovering gradually, although the impact of U.S. trade policies remains.”Regarding private consumption, the trend of “signs of a recovery” observed in September 2025 has continued. On the other hand, there are many concerns—such as the risk of rising prices due to the situation in the Middle East and developments in U.S. policy—and the situation does not allow for optimism regarding the recovery trend.
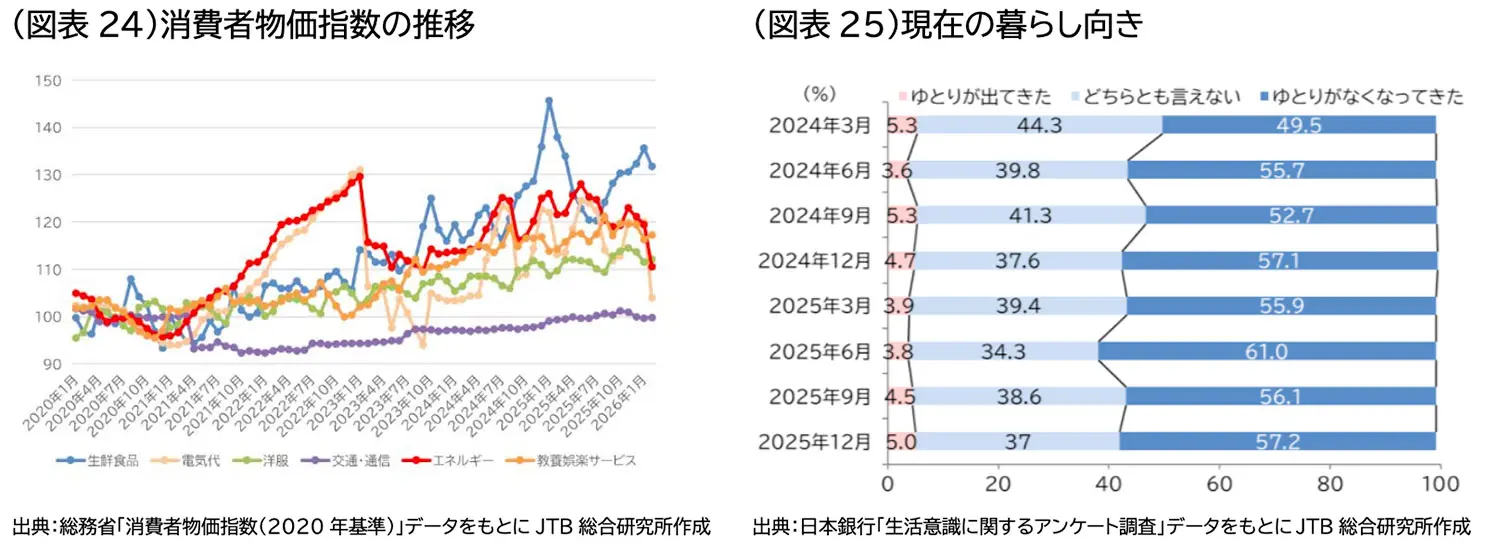
Looking at price trends, the key consumer price indices for January 2026 show that while “fresh food” prices continue to rise, prices for “energy,” “electricity,” and “clothing” have passed their peaks from the previous year, and the rate of increase is beginning to stabilize (Figure 24).Furthermore, regarding wages and consumption, although real wages were negative year-on-year for the full year of 2025, preliminary figures for January 2026 show a positive growth rate of 1.3%, indicating signs of improvement.The Bank of Japan’s “Survey on Attitudes Toward Living” also shows that since June 2025, the percentage of respondents reporting “I have more financial leeway” has been on the rise (Figure 25).
Current Lifestyle and How People Spend Golden Week
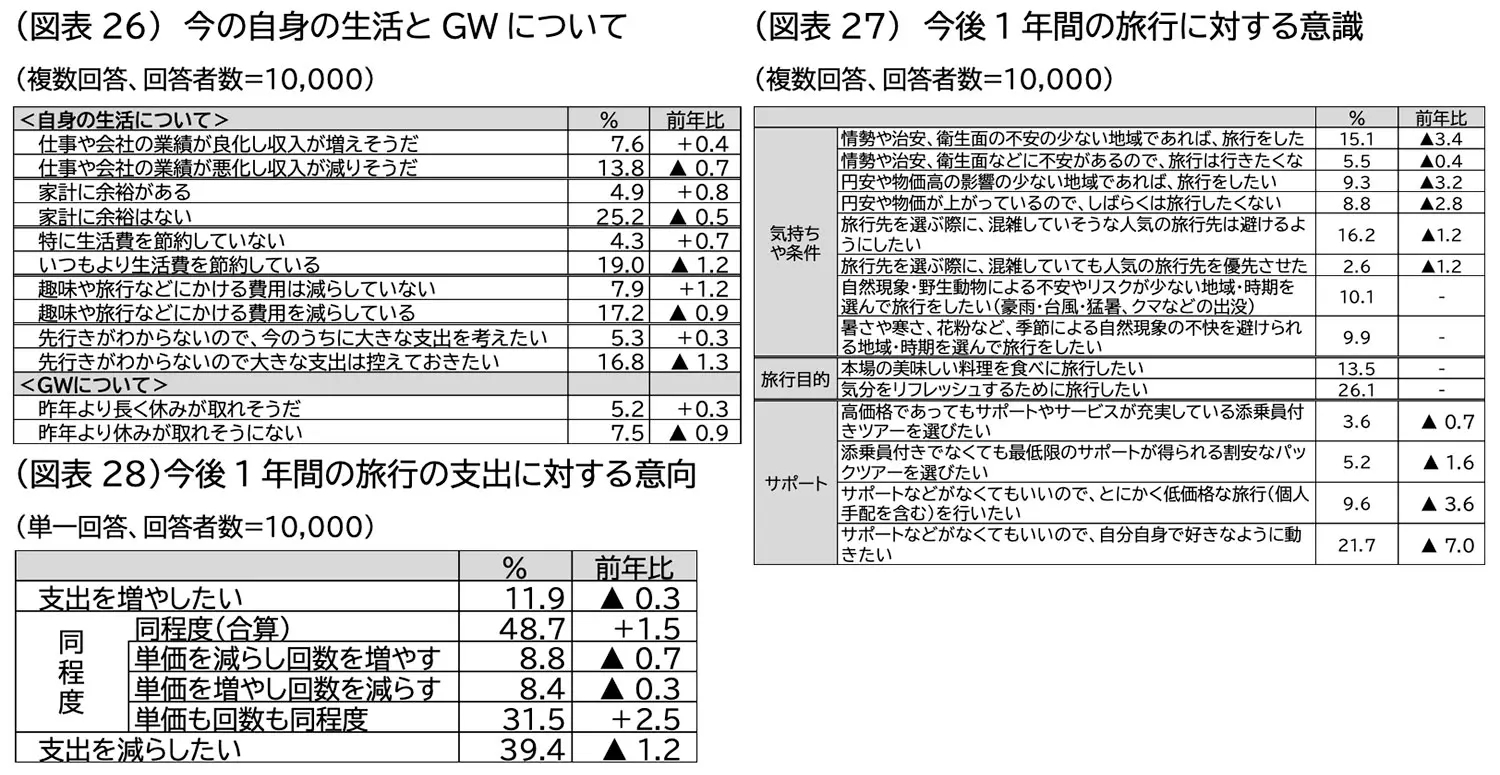
According to a survey conducted by JTB, regarding respondents’ current lifestyles and plans for Golden Week, the percentages of those who said “My work and my company’s performance are improving, so my income is likely to increase (7.6%)” and “My household budget has some leeway (4.9%)” increased compared to the previous year.Furthermore, the percentages of respondents who said, “I am not specifically cutting back on living expenses (4.3%),” “I have not reduced spending on hobbies or travel (7.9%),” and “Since the future is uncertain, I want to plan for major expenditures now (5.3%)” have also risen, suggesting a shift from the frugal mindset of previous years toward a more positive attitude toward spending.Even amid rising prices, it appears that more people will enjoy traveling while finding ways to keep costs down.Furthermore, thanks in part to the favorable calendar alignment, the percentage of respondents who said, “I’ll likely be able to take a longer vacation this Golden Week than last year (5.2%)” increased by 0.3 percentage points, while those who said, “I’ll likely be unable to take as much time off as last year (7.5%)” decreased by 0.9 percentage points; it is believed that the ease of taking time off is also contributing to the increase in overseas travel(Figure 26).
Regarding attitudes toward travel over the next year, while the percentage of respondents who said, “I would like to travel if it is to a region with few concerns regarding the political situation, public safety, or hygiene (15.1%)” decreased by 3.4 percentage points from the previous year, it still exceeds the percentage who said, “I do not want to travel because I have concerns regarding the political situation, public safety, or hygiene (5.5%).”Furthermore, the responses “I would like to travel to regions less affected by the weak yen and high prices (9.3%)” and “I do not want to travel for a while because of the weak yen and rising prices (8.8%)” are roughly equal, indicating that there is a significant number of people who are not concerned about the impact of prices and exchange rates.Furthermore, “I want to travel to regions and during seasons where there are few concerns or risks related to natural phenomena or wildlife (10.1%),”“I want to choose regions and times of year where I can avoid seasonal discomforts such as heat, cold, or pollen (9.9%),” indicating a desire to select safer and more comfortable travel destinations by taking natural phenomena and wildlife into account (Figure 27).
Regarding “intentions regarding travel spending over the next year,” the percentage of respondents who said they would “spend about the same” (combined total: 48.7%) increased by 1.5 percentage points from the previous year; looking at the breakdown, the percentage of those who said they would “spend about the same in terms of both cost per trip and frequency” (31.5%) increased by 2.5 percentage points.The percentage of respondents who “want to increase spending (11.9%)” decreased by 0.3 percentage points, while those who “want to reduce spending (39.4%)” decreased by 1.2 percentage points; overall, this suggests that consumers intend to travel while maintaining a budget at roughly the same level (Figure 28).
Keywords of Interest When Traveling
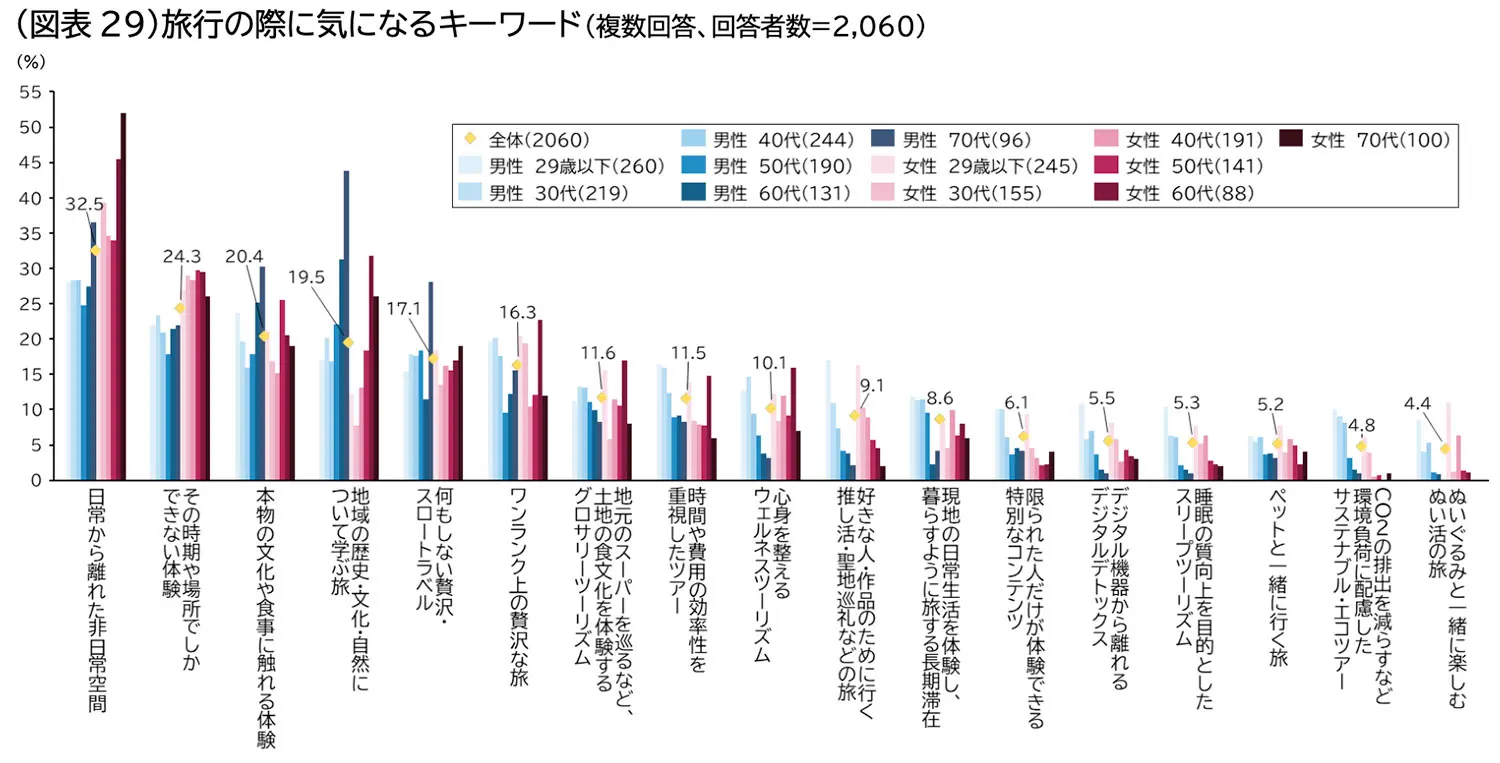
Finally, when we asked respondents in this survey who answered “I will go on a trip during this year’s Golden Week” about keywords that matter to them when traveling, “an extraordinary setting away from everyday life (32.5%)” was the most common response, followed by “experiences available only during that season or in that location (24.3%),”“Experiences that allow them to encounter authentic culture and cuisine (20.4%).” When broken down by gender and age group, “trips to learn about local history, culture, and nature” were highly ranked among men and women in their 60s and 70s, while among men and women aged 29 and under, “trips to see favorite people or works, such as ‘oshi-katsu’ (activities centered on favorite idols) or pilgrimages to sacred sites,” as well as“digital detoxes to disconnect from digital devices,” “sleep tourism aimed at improving sleep quality,” and “trips to enjoy ‘plushie activities’ with stuffed animals”—keywords closely tied to hobbies, self-rejuvenation, and social media—ranked highly.The values people seek in travel vary by generation, suggesting that travel is diversifying beyond traditional sightseeing to include experiences tailored to consumers’ interests (Figure 29).