Announcement of “Travel Trends for the 2026 Summer Vacation (July 15–August 31)”
This report is based on estimates derived from a survey conducted by the JTB Group, as well as various economic trends, industry trends, transportation and tourism-related data, accommodation booking status, and various opinion surveys. The survey has been conducted continuously since 1969. (Our company is responsible for the research and analysis for this report.)
Key Findings
- Although incomes are on the rise, high prices have led travelers to adopt a more selective approach, focusing on saving money and being resourceful. For domestic travel, spending time in cool indoor settings to escape the heat is popular, while for overseas travel, travelers are wisely choosing destinations where local prices and airfare are affordable.
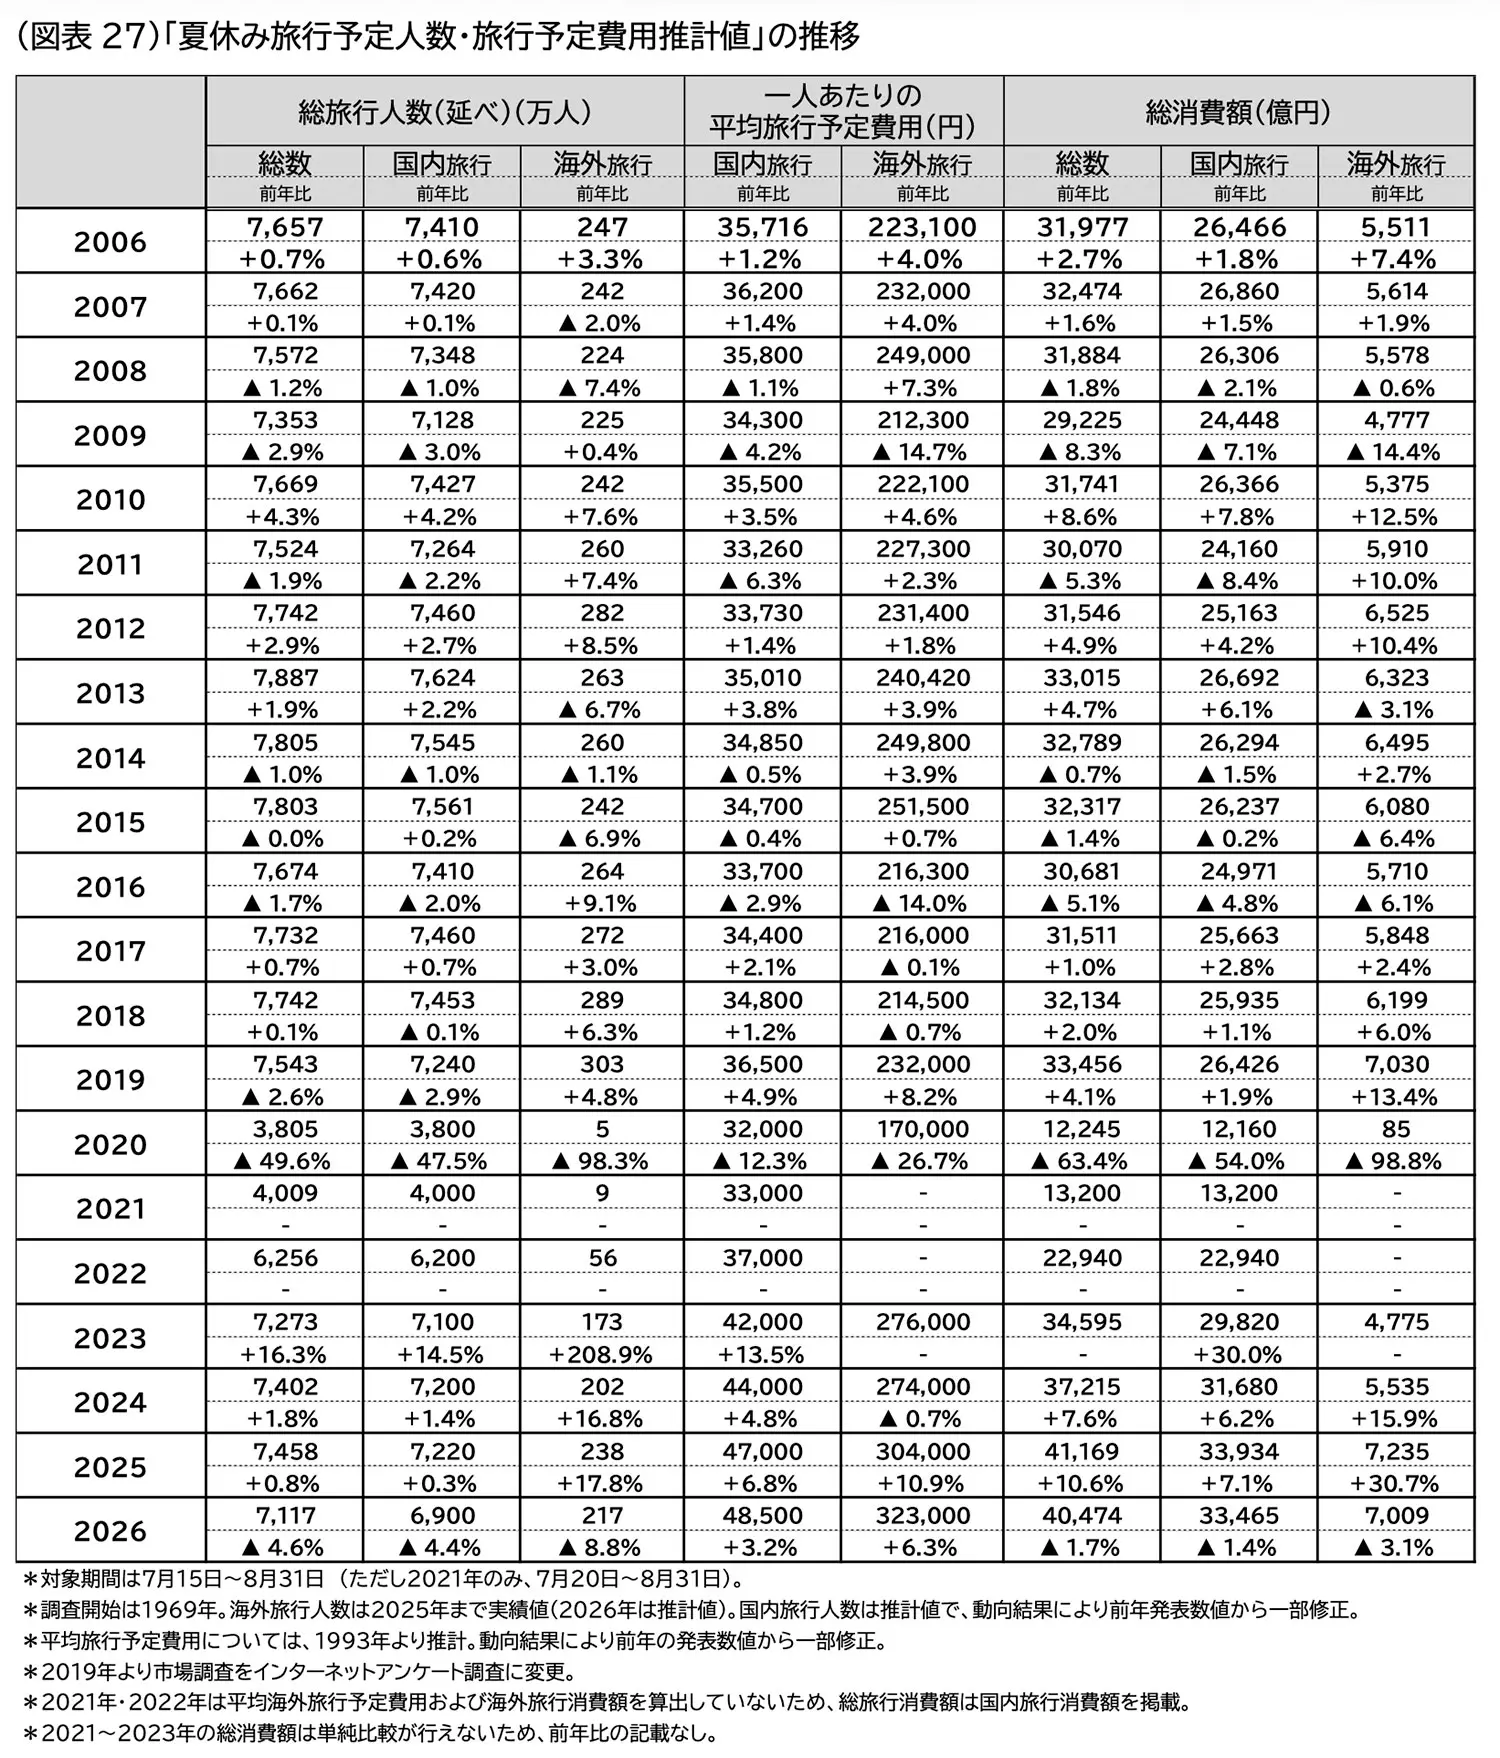
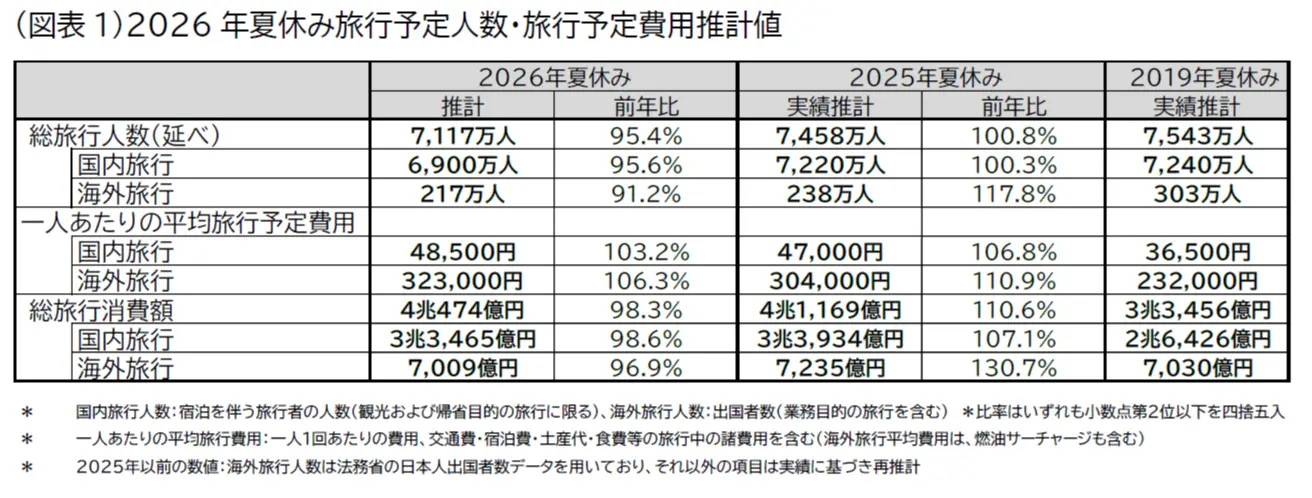
The total number of travelers during summer vacation was 71.17 million (95.4% of the previous year’s figure), and total travel spending was 4.0474 trillion yen (98.3% of the previous year’s figure). For domestic travel, the number of travelers was 69 million (95.6% of the previous year), the average planned travel expenditure was 48,500 yen (103.2% of the previous year), and travel spending totaled 3,346.5 billion yen (98.6% of the previous year). For overseas travel, the number of travelers was 2.17 million (91.2% of the previous year), the average planned travel expenditure was 323,000 yen (106.3% of the previous year), and travel spending totaled 700.9 billion yen (96.9% of the previous year)
Domestic Travel
- While an increase in salary income and summer bonuses is expected, the number of travelers is forecast to decline slightly from last year due to a growing tendency toward frugality that outweighs these factors
- Average planned travel expenses (per person) are expected to rise for the second consecutive year, driven by rising prices resulting from inflation and other factors. Consumers are adopting a selective spending approach, maintaining spending on items they personally value.
- As a measure to cope with the heat while traveling, there is growing interest in staying indoors, sightseeing that minimizes travel, and touring during cooler times of day, such as early morning and evening.
Travel Abroad
- The number of travelers is expected to decline from last year due to factors such as the international situation and the weak yen
- Average planned travel expenses (per person) are trending upward due to factors such as rising fuel surcharges
- As a way to keep costs down, there is a growing trend toward choosing destinations where local prices are reasonable, the impact of the weak yen is minimal, and airfares are relatively inexpensive
- Travel dates are somewhat spread out around the summer vacation period, including the five-day “Silver Week” holiday in September
Estimated Number of Travelers and Estimated Travel Expenses for the 2026 Summer Vacation
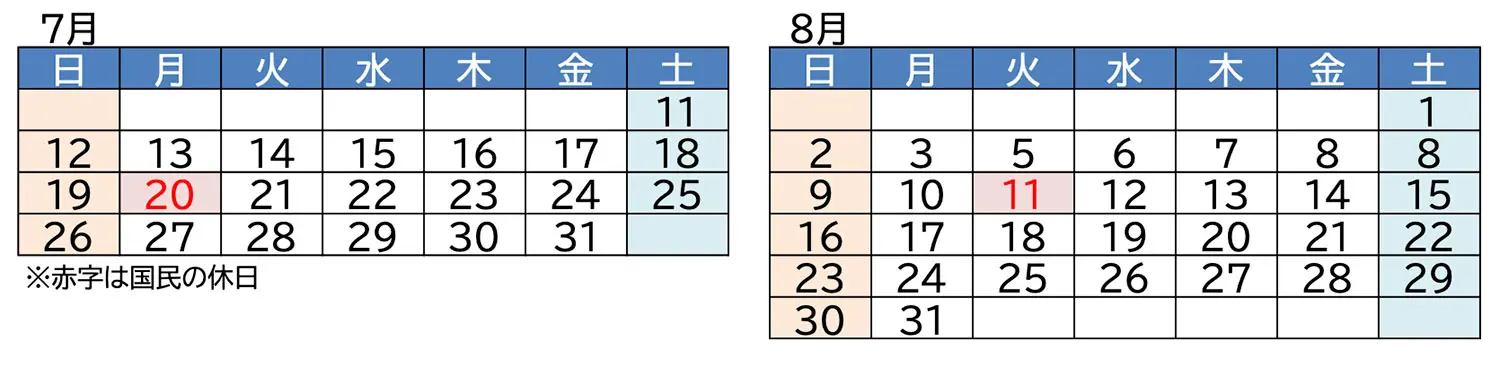
This Year's Summer Vacation Calendar (July 15–August 31) and Travel Trends
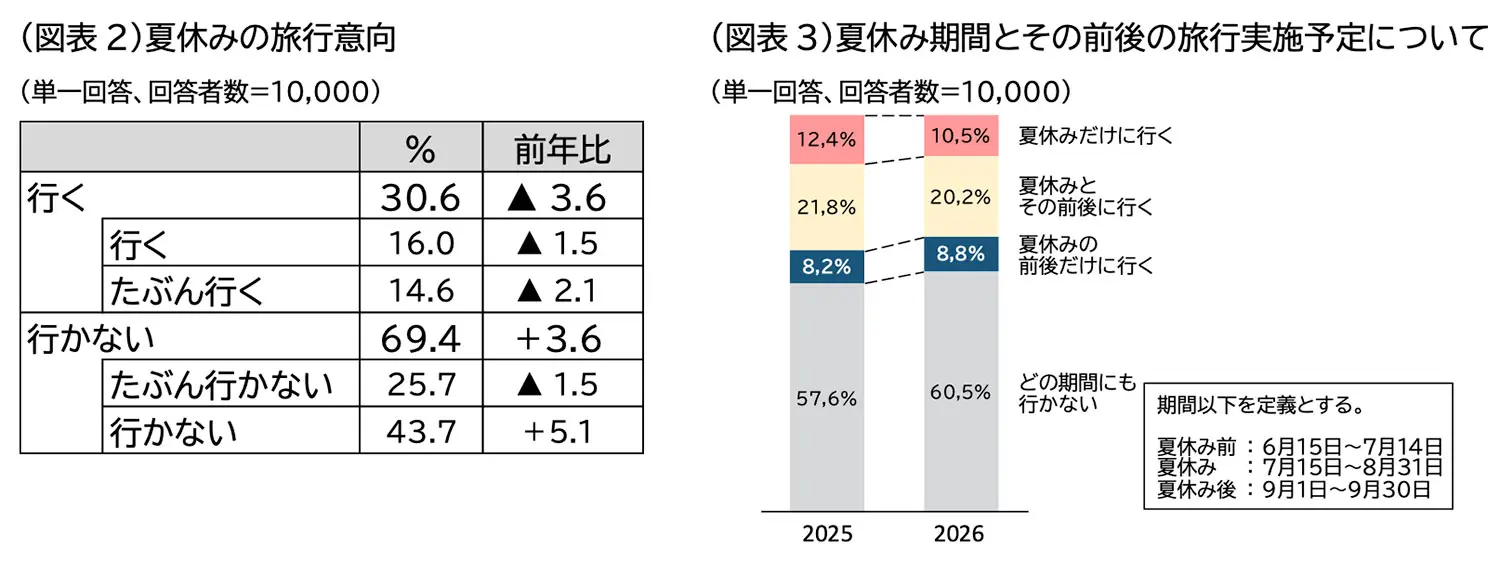
We asked about the details of travel plans—including trips home to visit family—for the 2026 summer vacation (departures from July 15 to August 31) in the aforementioned survey.Regarding travel intentions for this summer vacation, 30.6% of respondents stated they would “go” (combining “definitely” and “probably”) at the time of the survey, a decrease of 3.6 percentage points from the previous year (Figure 2).Furthermore, when asked about travel plans for the period before summer vacation (June 15–July 14) or after summer vacation (September 1–September 30), the percentage of respondents who said they would “travel only during summer vacation (10.5%)” decreased by 1.9 percentage points from the previous year,and “I will travel during summer vacation and before and after it (20.2%)” decreased by 1.6 percentage points, while “I will travel only before and after summer vacation (8.8%)” increased by 0.6 percentage points.This suggests a growing trend of traveling before or after the summer vacation period to avoid crowds and rising prices (Figure 3).
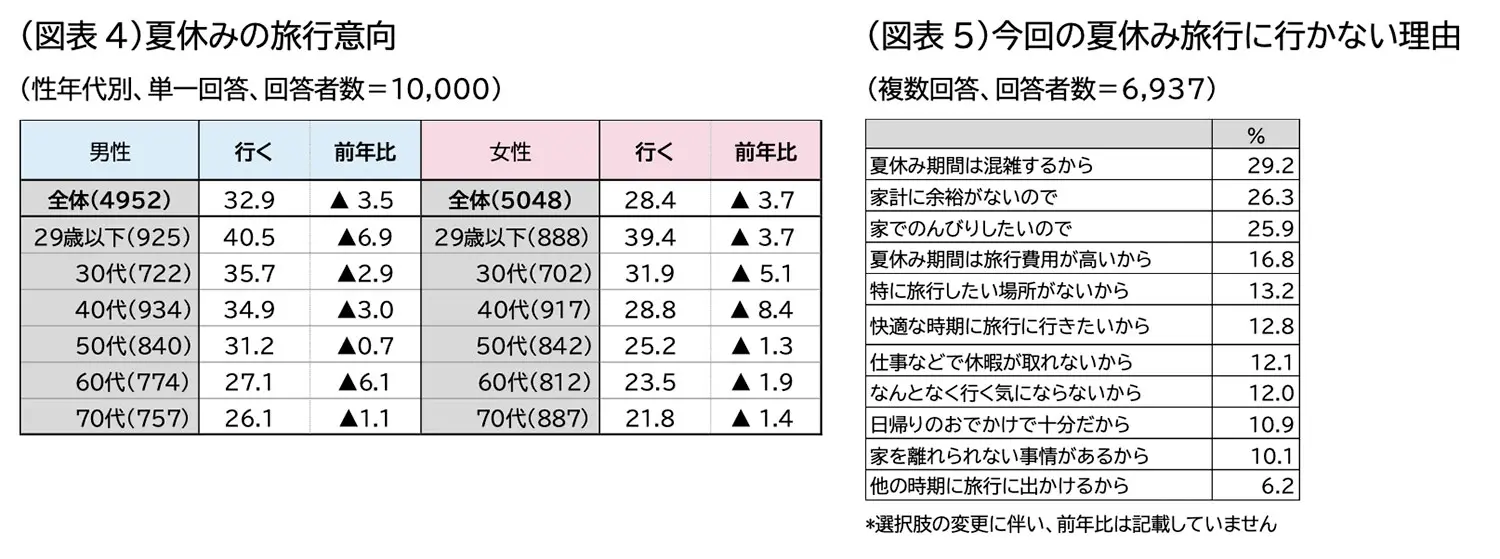
When broken down by gender and age group, both men and women showed a tendency for travel intentions to be higher among younger age groups. The percentage of respondents who said they “will go” (the combined total of “will go” and “probably will go”) was highest among men aged 29 and under at 40.5% and among women aged 29 and under at 39.4%, though both figures were down from the previous year.Although the figures decreased across all age groups compared to the previous year, the rate of decline was smallest among women in their 50s and older (Chart 4).
When asked why they would not travel, the most common reason was “because it gets crowded during summer vacation (29.2%),” followed by “because our household budget doesn’t allow for it (26.3%),” “because I want to relax at home (25.9%),” and “because travel costs are high during summer vacation (16.8%)”(Figure 5).
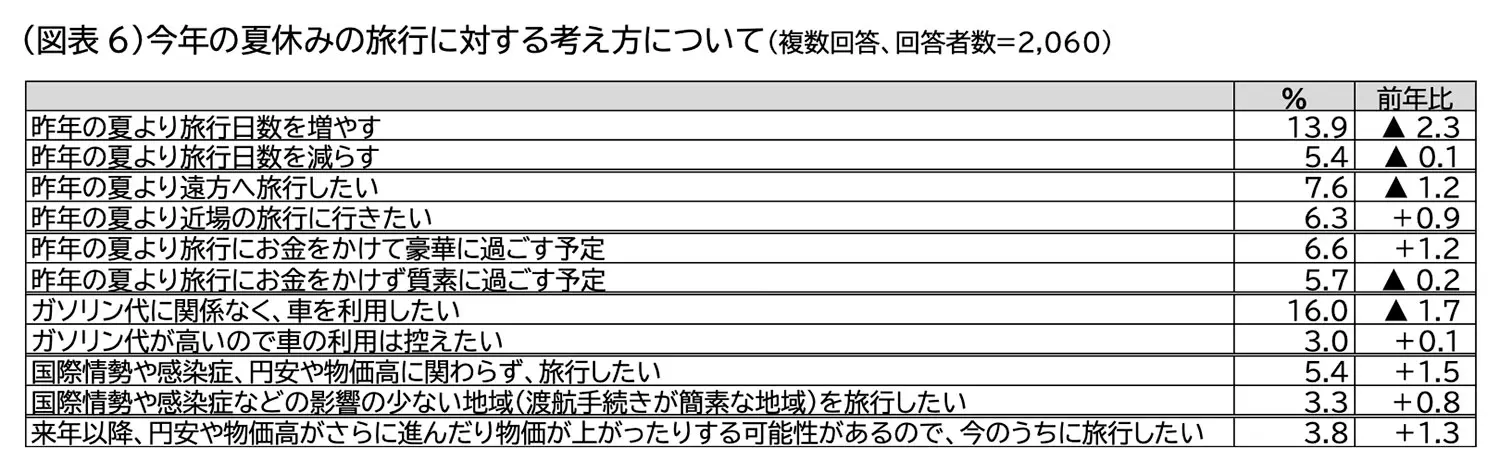
Next, we asked the 2,060 survey respondents who answered “I will go on a trip this summer vacation” about their attitudes toward this year’s summer vacation travel.
While 13.9% said they would “travel for more days than last summer,” a decrease of 2.3 percentage points from the previous year, this figure still significantly exceeded the 5.4% who said they would “travel for fewer days than last summer.”In addition, while “I want to travel farther than last summer’s vacation (7.6%)” exceeded “I want to take a trip closer to home than last summer’s vacation (6.3%),” the gap narrowed from 3.4 percentage points the previous year to 1.3 percentage points.Furthermore, the percentage of respondents who “plan to spend money and enjoy a luxurious vacation (6.6%)” increased by 1.2 percentage points from the previous year, while those who “plan to spend little money and enjoy a modest vacation (5.7%)” decreased by 0.2 percentage points.Regarding gas prices, while the percentage of respondents who “want to use a car regardless of gas prices (16.0%)” decreased by 1.7 percentage points from the previous year, it still significantly exceeds the percentage who “want to avoid using a car because gas prices are high (3.0%).”
Additionally, “I want to travel regardless of the international situation, infectious diseases, the weak yen, or high prices (5.4%),” “I want to travel to regions less affected by the international situation or infectious diseases (3.3%),”“I want to travel now because there is a possibility that the weak yen and high prices will worsen or that prices will rise further next year and beyond (3.8%)”—all of these responses increased, indicating a steady desire to travel even under these circumstances (Figure 6).
Trends in Domestic Travel
The number of domestic travelers is projected to be 69 million (95.6% of the previous year’s figure), the average planned spending per person on domestic travel is projected to be 48,500 yen (103.2% of the previous year’s figure), and total domestic travel spending is projected to be 3.3465 trillion yen (98.6% of the previous year’s figure)(Figure 1).
We analyzed the travel trends of the 1,921 respondents (out of the 2,060 who answered that they would travel this summer) who indicated “within Japan” as their destination in the main survey regarding travel during this year’s summer vacation.
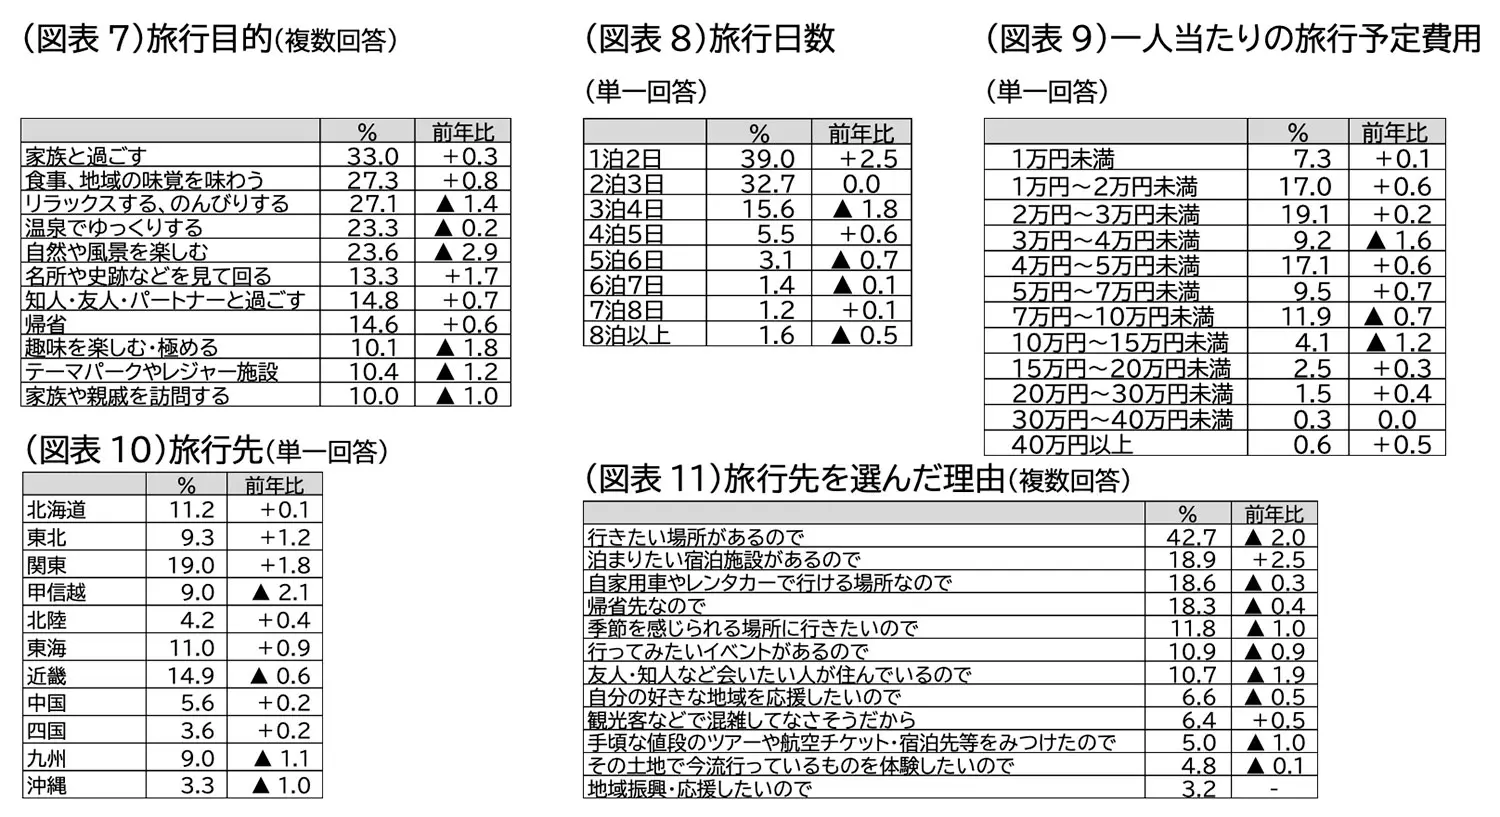
Purpose of travel: “Spending time with family (33.0%)” was the most common response, showing an increase of 0.3 percentage points.Next was “Enjoying meals and local cuisine (27.3%),” which increased by 0.8 percentage points; “Relaxing and taking it easy (27.1%)” decreased by 1.4 percentage points; and “Unwinding at hot springs (23.3%)” decreased by 0.2 percentage points(Figure 7).
Duration of trips: Overall, “1 night, 2 days (39.0%)” was the most common, increasing by 2.5 percentage points from the previous year.On the other hand, “2 nights, 3 days (32.7%)” remained flat, while “3 nights, 4 days (15.6%)” decreased by 1.8 percentage points; this indicates that trips of 1 night and 4 nights increased, while those of 2 nights and 3 nights decreased (Figure 8).
Planned travel expenses per person: Overall, “20,000 yen to less than 30,000 yen (19.1%)” was the most common, followed by “40,000 yen to less than 50,000 yen (17.1%)” and “10,000 yen to less than 20,000 yen (17.0%)”; all of these categories showed an increase compared to the previous year (Figure 9).
Travel Destinations: “Kanto (19.0%)” was the most popular, followed by “Kinki (14.9%)”, “Hokkaido (11.2%)”, and “Tokai (11.0%)”.In terms of growth rates, “Kanto” increased by 1.8 percentage points, and “Tohoku (9.3%)” increased by 1.2 percentage points.On the other hand, in terms of decline rates, “Koshinetsu” fell by 2.1 percentage points, “Kyushu (9.0%)” by 1.1 percentage points, and “Okinawa (3.3%)” by 1.0 percentage points (Figure 10).
As for the reasons for choosing a travel destination, “There is a place I want to visit (42.7%)” was the most common response, though it decreased by 2.0 percentage points.This was followed by “There is an accommodation I want to stay at (18.9%),” “It is a place I can reach by private car or rental car (18.6%),” and “It is my hometown (18.3%).”While many reasons showed a decrease compared to the previous year, “There is an accommodation facility I want to stay at” increased by 2.5 percentage points, and “It doesn’t seem crowded with tourists” increased by 0.5 percentage points (Figure 11).
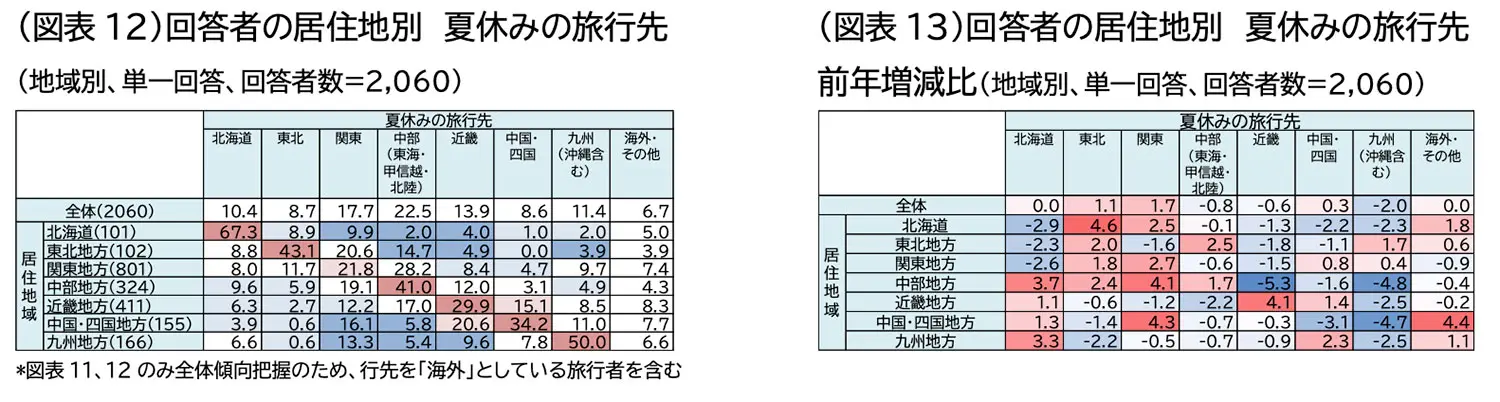
Looking at travel destinations by region of residence, the proportion of “intra-regional travel” (where the travel destination is in the same region as the place of residence) exceeded 50% in two regions: “Hokkaido (67.3%)” and “Kyushu (50.0%)”.On the other hand, while 21.8% of residents in the Kanto region traveled to “Kanto,” 28.2% traveled to “Chubu,” continuing the trend from the previous year of the destination exceeding the region of residence (Figure 12).Compared to the previous year, the proportion of intra-regional travel increased in the “Tohoku,” “Kanto,” “Chubu,” and “Kinki” regions.Furthermore, among residents of the “Chubu,” “Kinki,” “Chugoku/Shikoku,” and “Kyushu” regions, travel to “Hokkaido” increased while travel to “Kyushu” decreased (Figure 13).
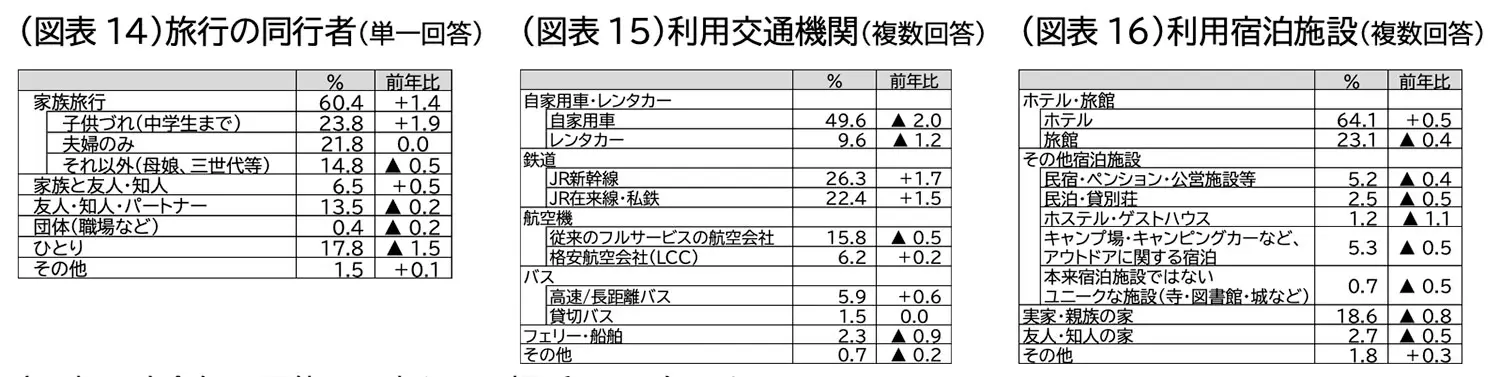
Travel companions: “Family trips with children (up to junior high school age) (23.8%)” were the most common, followed by “just the couple (21.8%)” and “alone (17.8%)”.Looking at changes from the previous year, while “traveling with children (up to junior high school age)” and “traveling with family, friends, and acquaintances (6.5%)” increased, “traveling alone” saw the largest decline, dropping by 1.5 percentage points (Figure 14).
Means of Transportation: “Private car (49.6%)” was the most common, followed by “JR Shinkansen (26.3%)” and “JR conventional lines and private railways (22.4%)”.Looking at the rate of decrease compared to the previous year, “private cars (49.6%)” fell by 2.0 percentage points, “rental cars (9.6%)” by 1.2 percentage points, and “traditional full-service airlines (15.8%)” by 0.5 percentage points.It is possible that the recent upward trend in gasoline prices has influenced the decline in the use of “private cars” and “rental cars,” as well as the increase in the use of “low-cost carriers (LCCs)” and “JR conventional lines and private railways” (Figure 15).
Accommodation used: “Hotels (64.1%)” were the most common choice, representing a 0.5-point increase from the previous year.Next were “ryokan (traditional Japanese inns) (23.1%),” which decreased by 0.4 percentage points, and “parents’ or relatives’ homes (18.6%),” which decreased by 0.8 percentage points (Chart 16).
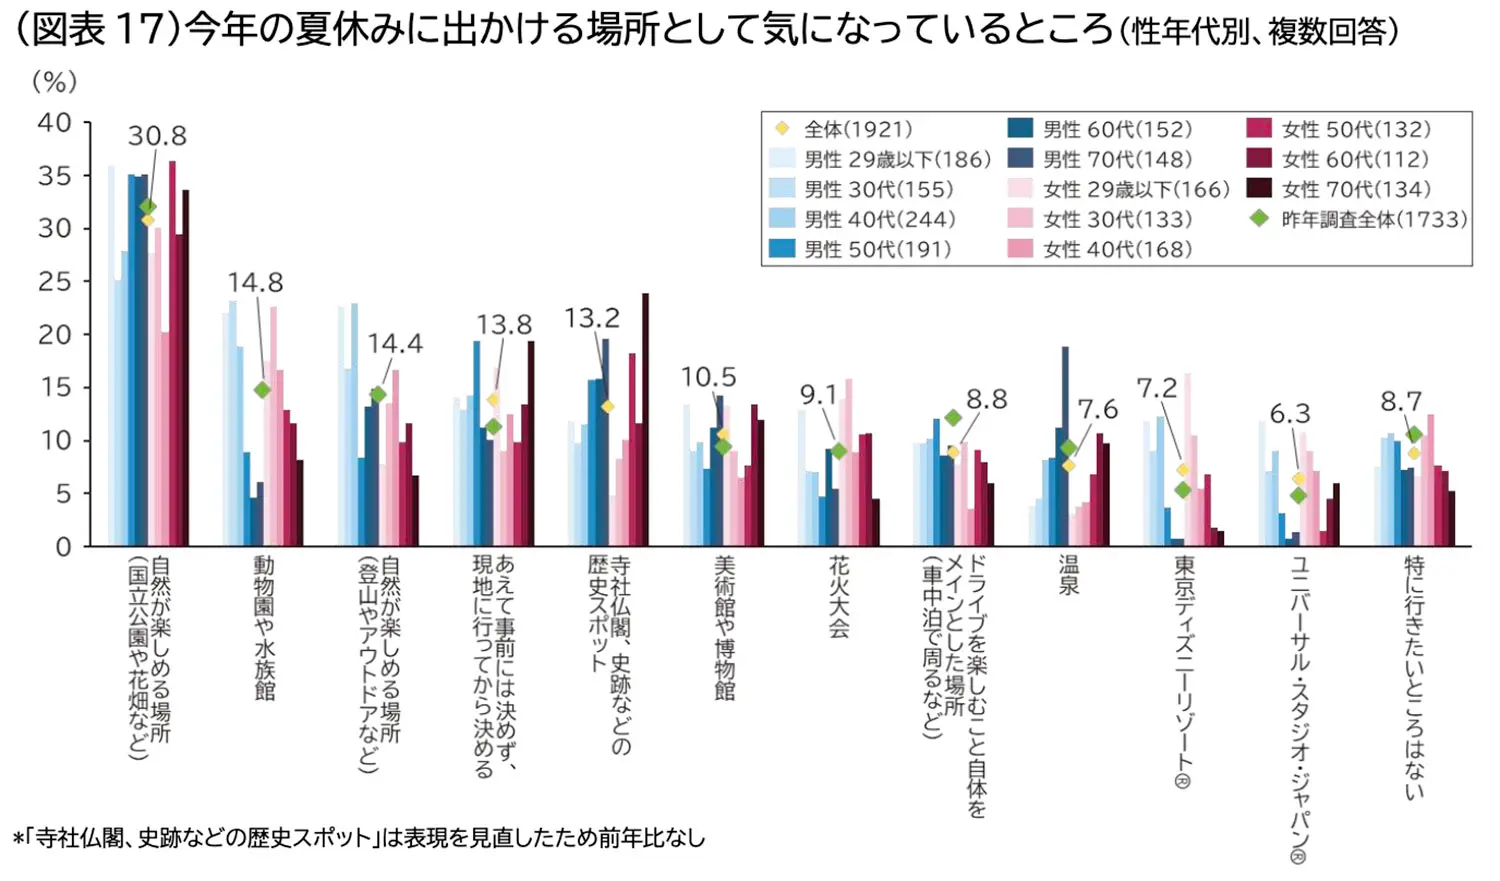
As for places people are interested in visiting, “places to enjoy nature (such as national parks and flower fields)” (30.8%) ranked first, followed by “zoos and aquariums” (14.8%).When broken down by gender and age group, “places to enjoy nature (such as hiking and outdoor activities)” were most popular among men in their 20s (22.6%) and 40s (23.0%), while “I prefer not to decide in advance and will decide once I arrive”was most common among men in their 50s (19.4%) and women in their 70s (19.4%), while “historical sites such as temples, shrines, and historic sites” was most popular among women in their 60s. These findings reveal distinct patterns in how people enjoy the summer based on gender and age (Figure 17).
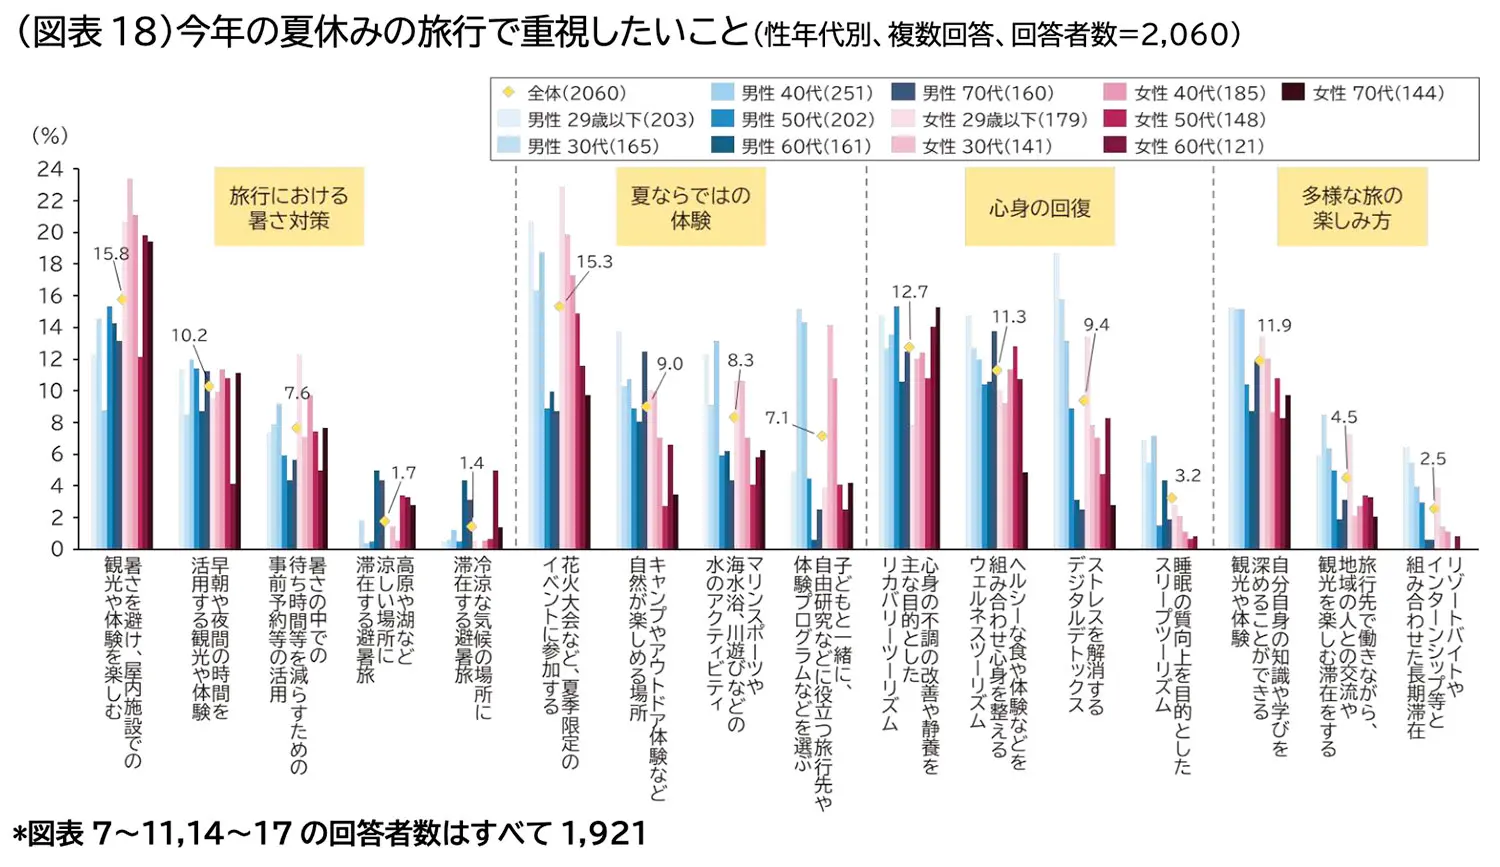
Furthermore, when asked about priorities for this summer’s vacation—such as “measures to cope with the heat while traveling,” “experiences unique to summer,” and “physical and mental recovery”—the responses were highest for “avoiding the heat and enjoying sightseeing and activities at indoor facilities (15.8%),”“participating in summer-exclusive events such as fireworks displays (15.3%),” and “recovery tourism, primarily aimed at improving physical and mental well-being or resting (12.7%).”Among the options related to heat countermeasures, a high percentage of respondents cited sightseeing and activities that take advantage of indoor facilities or early morning and evening hours; furthermore, “making advance reservations to reduce waiting times in the heat (7.6%)” was particularly popular among women aged 29 and under.Furthermore, regarding physical and mental recovery, “digital detox to relieve stress (9.4%)” was particularly high among both men and women aged 29 and under (Figure 18).
Popular domestic travel destinations according to JTB include Okinawa, Hokkaido, and Tokyo—including Tokyo Disney Resort®.
In the Tohoku region, travel to experience seasonal events, such as summer festivals, is popular.
Trends in Overseas Travel
The number of outbound travelers was estimated at 2.17 million (91.2% of the previous year’s figure).This is believed to be due to factors such as the international situation, rising fuel surcharges, and travelers spreading out their trips around the summer vacation period to keep costs down. On the other hand, there continues to be a trend of travelers finding creative ways to enjoy overseas travel even amid soaring costs by choosing countries where local prices and airfares are relatively low.
The average planned expenditure per person for overseas travel is 323,000 yen (106.3% of the previous year’s figure), and total overseas travel spending is 700.9 billion yen (96.9% of the previous year’s figure). Specific trends are as follows.
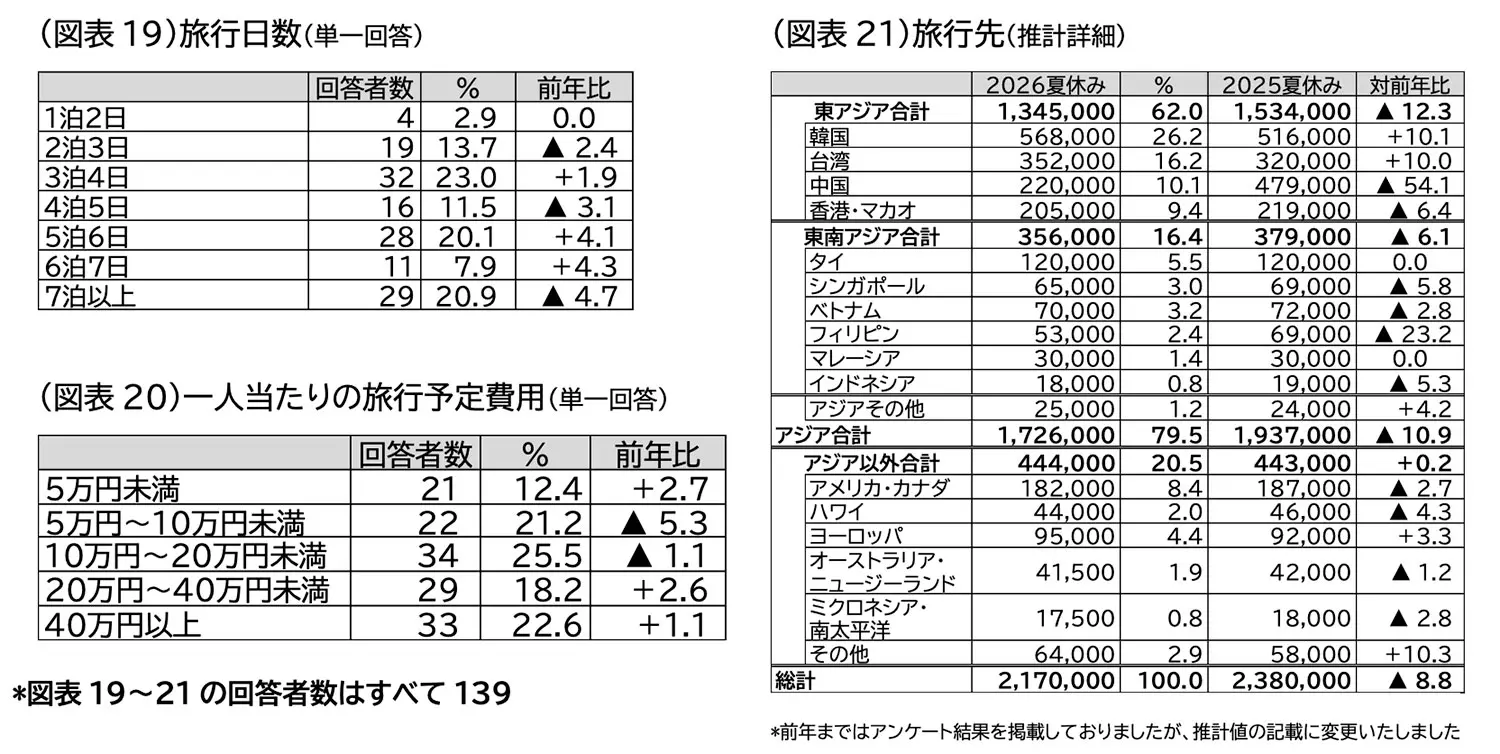
Of the 2,060 respondents in this survey, 139 (6.7%) indicated that their summer vacation destination this year would be “overseas.” The most common trip duration was “3 nights and 4 days” (23.0%), an increase of 1.9 percentage points from the previous year.This was followed by “7 nights or more (20.9%),” which decreased by 4.7 percentage points, and “5 nights and 6 days (20.1%),” which increased by 4.1 percentage points (Figure 19).
The most common per-person expense range was “100,000 to less than 200,000 yen (25.5%),” followed by “400,000 yen or more (22.6%)” and “50,000 to less than 100,000 yen (21.2%).”Compared to the previous year, the “less than 50,000 yen (12.4%)” category increased by 2.7 percentage points, while the mid-range category of 50,000 yen to less than 200,000 yen decreased, showing a slight trend toward polarization (Figure 20). Estimates were made for travel destinations by country and region.Ranked from highest to lowest, “South Korea (26.2%)” was the most popular, followed by “Taiwan (16.2%)”. Furthermore, Southeast Asia as a whole accounted for 16.4% of the total, while Asia as a whole accounted for 79.5%.Meanwhile, looking at year-over-year growth rates, nearby “South Korea” saw an increase of 10.1 percentage points,“Taiwan” rose by 10.0 points, and “Other Asian Destinations” increased by 4.2 points. This suggests that, in light of the current situation, travelers are making smart choices by seeking destinations that are close by, have affordable local prices, are less affected by the weak yen, and offer relatively inexpensive airfares (Figure 21).
JTB’s most popular overseas travel destinations are Hawaii, Singapore, Guam, South Korea, and the United States. Within the U.S., the West Coast is particularly popular; thanks in part to the success of Japanese players, trips to watch MLB™ games have become a popular choice.
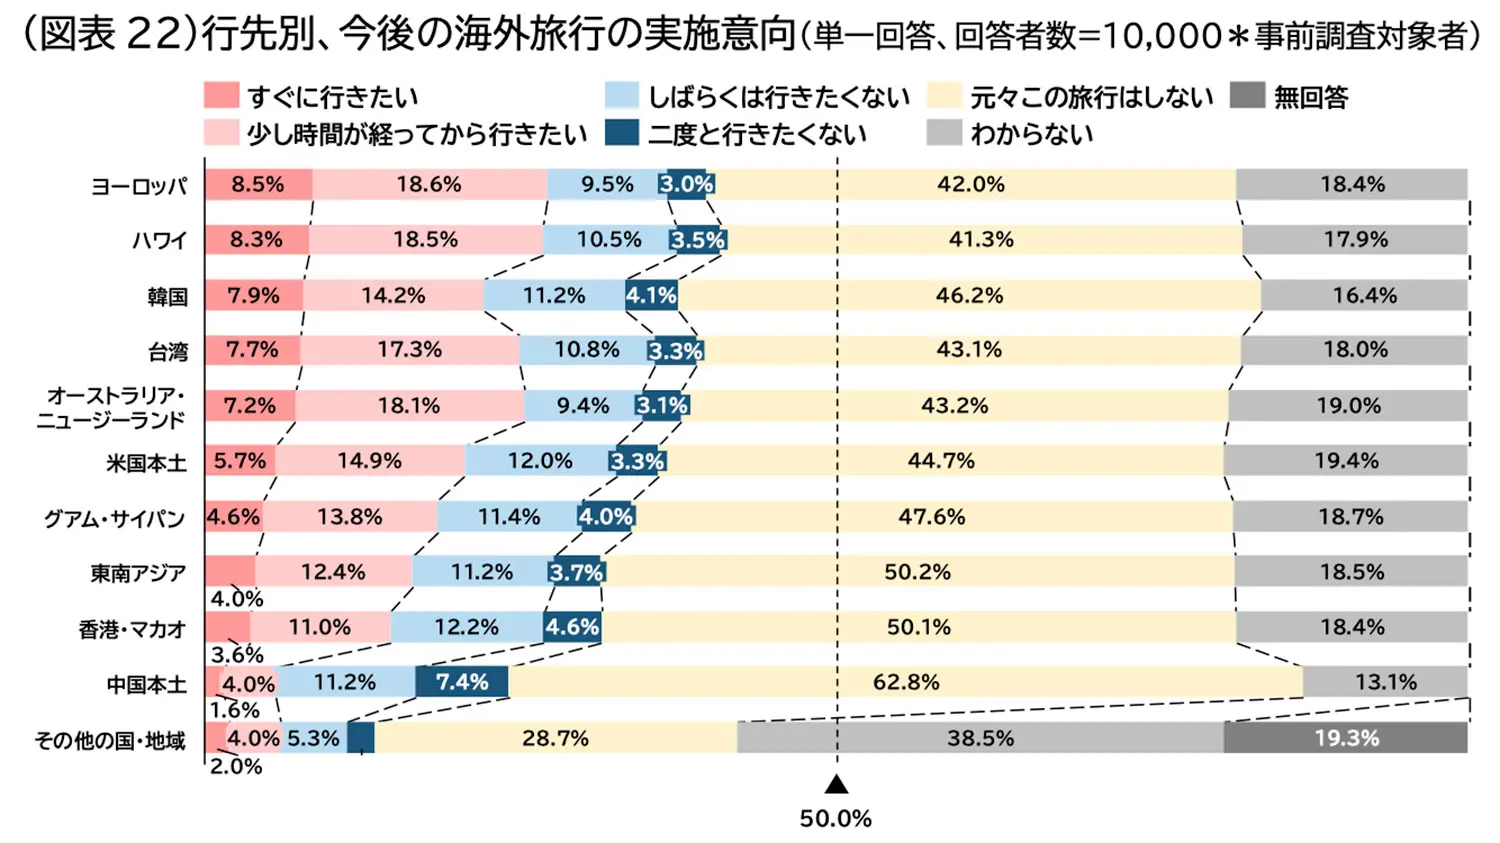
Next, we asked the survey respondents—including those who do not plan to travel this summer—about their intentions regarding future overseas travel.When looking at the intended timing of overseas travel by destination, the highest percentage of respondents who said they “want to go right away” was for “Europe (8.5%),” followed by “Hawaii (8.3%)” and “South Korea (7.9%),” though all of these figures were down from the previous year (Chart 22).
The Economic Environment and Consumer Attitudes Surrounding Travel and Leisure Spending
Although the Japanese economy faces uncertainties, such as the impact of the situation in the Middle East, it continues to show a gradual recovery at present.The Cabinet Office’s Monthly Economic Report (May 2026) assesses the underlying economic trend as “recovering gradually, but the impact of the situation in the Middle East must be closely monitored.” Regarding personal consumption, it states, “Signs of a recovery are evident. However, caution is warranted as consumer sentiment has been weak recently.”
The Nikkei Stock Average has fluctuated significantly since the beginning of 2026. Although it fell to a year-to-date low of nearly 51,000 yen at the end of March, it subsequently rebounded and surpassed its all-time high of 70,000 yen on June 16.According to summer bonus forecasts released by several research institutions, the per-employee bonus amount at private companies is expected to increase by around 2 percent year-over-year, which is expected to underpin consumption.
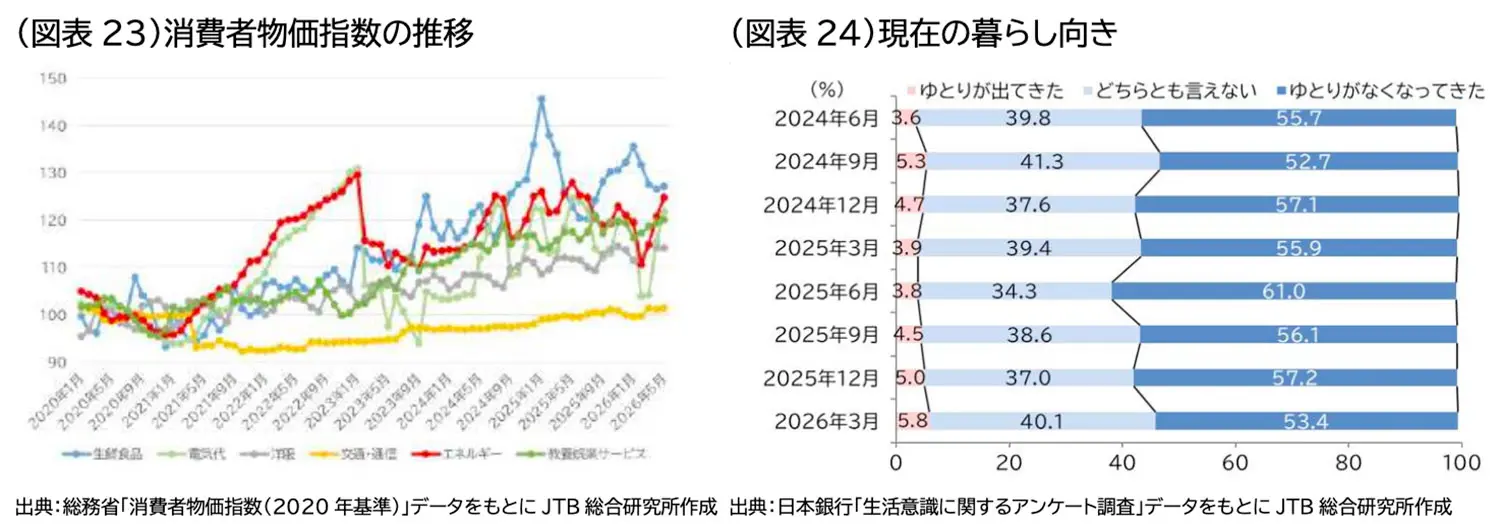
On the other hand, prices continue to rise; in May 2026, the national Consumer Price Index (CPI) rose 1.5% YOY overall and 1.8% YOY when excluding fresh food and energy.Looking at major categories, prices are trending upward from the previous month in all categories except “clothing.” Additionally, gasoline prices have been kept in the 150–180 yen range since March due to the government’s emergency measures to mitigate sudden price fluctuations, with the national average retail price standing at 169.7 yen as of June 15.According to the Bank of Japan’s “Survey on Living Conditions,” although the proportion of respondents stating that “financial leeway is becoming tighter” still exceeds half, this figure has declined since the previous survey, indicating signs of a slight recovery in living conditions (Figure 24).
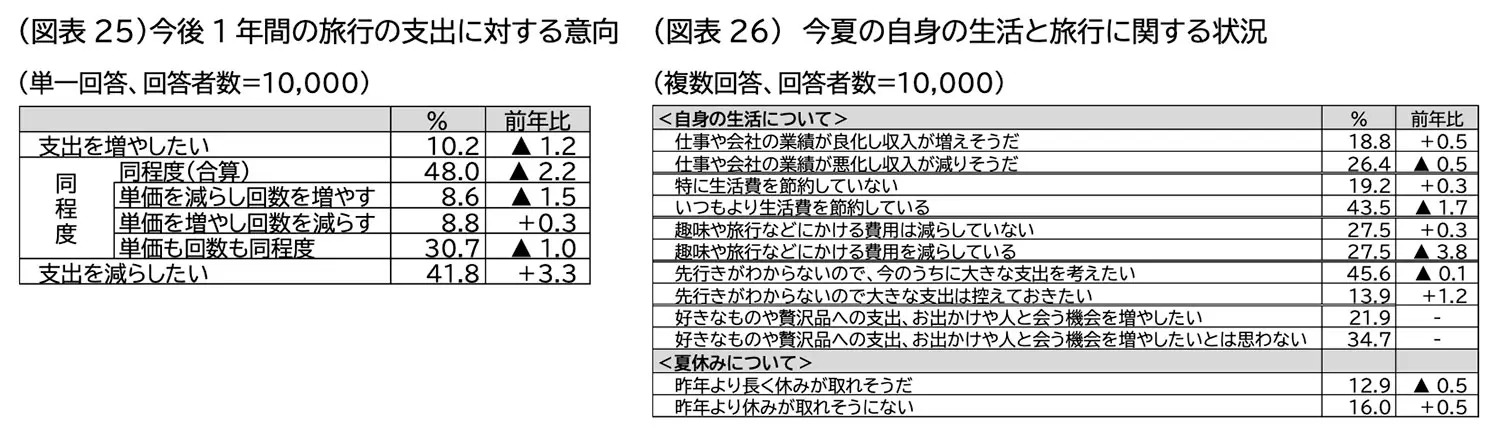
In a survey conducted by JTB regarding “intentions for travel spending over the next year,” the percentage of respondents who said they “want to reduce travel spending compared to before” (41.8%) increased by 3.3 percentage points from the previous year, while those who said they “want to increase travel spending compared to before” (10.2%) decreased by 1.2 percentage points.This marks the third consecutive year that the intention to reduce spending has increased. This suggests that while people intend to keep their overall travel spending in check, they plan to travel in a more thoughtful and balanced manner (Figure 25).
Furthermore, regarding “personal circumstances related to daily life and travel this summer,” the percentage of respondents who said, “My work or my company’s performance is improving, so my income is likely to increase (18.8%)” rose by 0.5 percentage points from the previous year,while “My work or company’s performance is likely to worsen, leading to a decrease in income” (26.4%) decreased by 0.5 percentage points, “I am not specifically cutting back on living expenses” (19.2%) increased by 0.3 percentage points, and “I am cutting back on living expenses more than usual” (43.5%) decreased by 1.7 percentage points.While the overall proportions remain largely unchanged, a slight trend toward improvement is evident in terms of income.
On the other hand, regarding spending, “I have not reduced my spending on hobbies, travel, etc.” increased by 0.3 percentage points from the previous year, while “I am reducing my spending on hobbies, travel, etc.” decreased by 3.8 percentage points; both stood at 27.5%.Additionally, while “Because the future is uncertain, I want to consider major expenditures now” (45.6%) decreased by 0.1 percentage points, “Because the future is uncertain, I want to refrain from major expenditures” (13.9%) increased by 1.2 percentage points.Although consumers harbor concerns about the future, they appear to be spending their money selectively—maintaining spending on items they personally value, for example (Figure 26).