Survey on Technology and Travel (2026) (Formerly “Survey on Smartphone Use and Travel Spending”)
AI Becomes Part of Everyday Life, While Digital Perspectives Expand Real-World Experiences
The “Survey on Smartphone Use and Travel Spending,” which began in 2013, reached its 10th anniversary last year. During that time, advancements in various technologies—not just smartphones—have transformed people’s lives. Starting with this 11th edition, we have renamed the survey “Survey on Technology and Travel” with the aim of capturing, more broadly and in greater depth, the impact that technological advancements have on people’s lives and travel behavior.
<Definitions Used in This Survey>
・Generative AI: AI that generates new content—such as text, images, audio, or video—in response to input, such as questions or requests
・AI-Related Services: A general term that includes not only generative AI but also services covered in this survey that utilize AI, such as image and audio-based search.
Key Findings
- The usage rate of AI-related services rose by 8.8 percentage points from last year to 67.5 percent. The use of AI as a means of information retrieval is also on the rise.
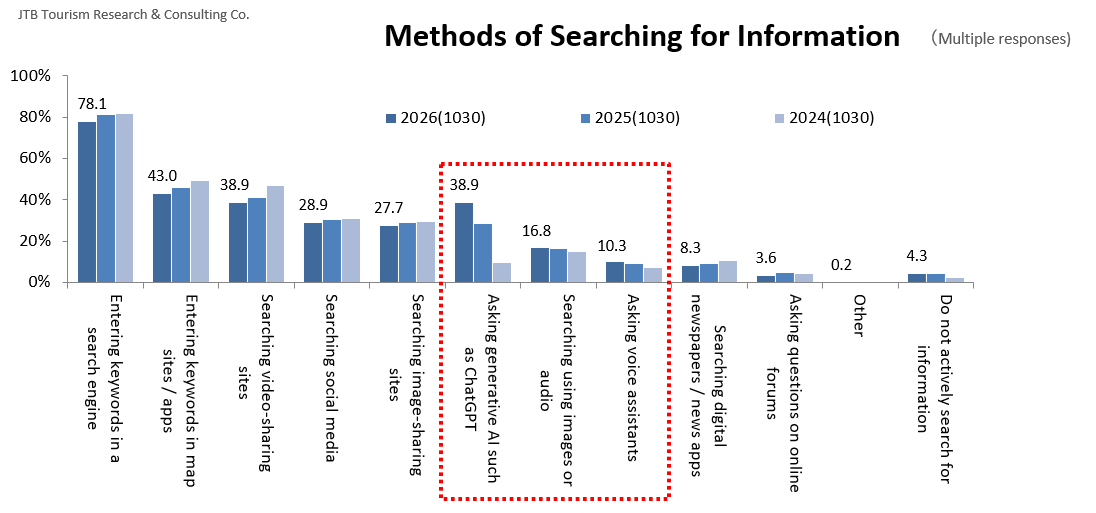
- The use of AI for information retrieval, such as “asking generative AI questions,” “searching using images or audio,” and “asking voice assistants,” is on the rise, while the use of search engines and map apps is on the decline.
- 38.7% of people who use generative AI daily view it as a “good advisor” or a “trusted friend.”
- The AI services people would like to try while traveling include “itinerary and route suggestions,” “searching for dining information at their destination,” and “getting advice on what to do at their destination.”
- Among the social media platforms used, Setlog has a usage rate of over 30% among women aged 29 or younger, surpassing BeReal's 14.6%.
- While LINE, YouTube, and X remain at the top, usage rates for LINE and YouTube have declined slightly.
- Social Media Videos Encourage People to Visit Featured Locations
- 28.2% of people who watch social media videos for 2 to 4 hours a day have visited locations featured in the videos.
- Compared with regular videos, short videos serve as a gateway to “unexpected information.”
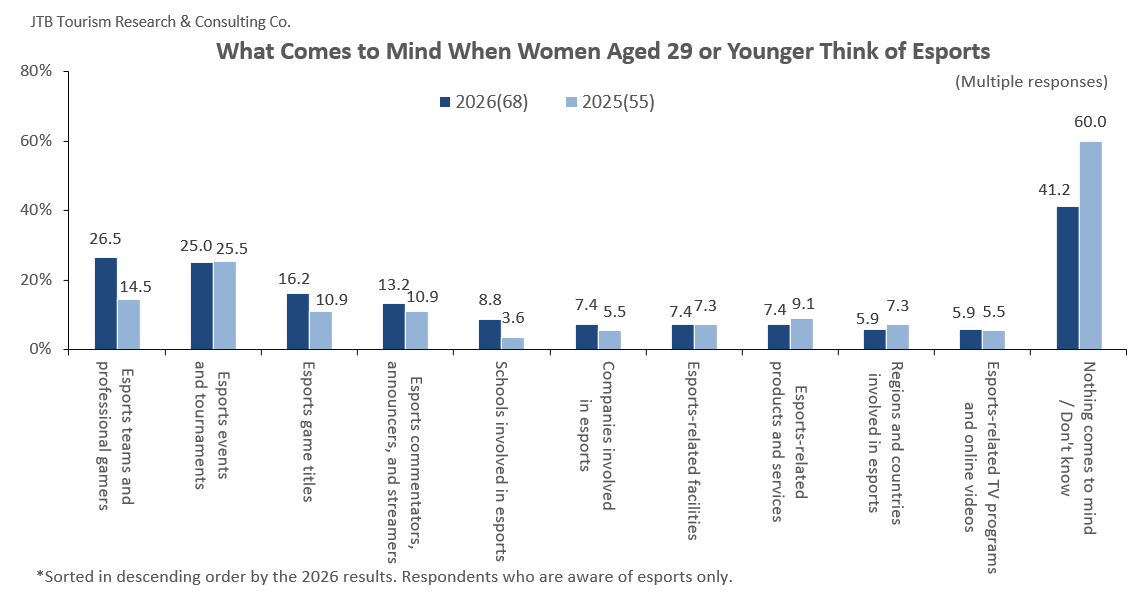
- “Supporting Your Favorite Players” in Esports, too? Among women aged 29 or younger, the association of esports with “esports teams and professional gamers” has grown rapidly.
- The percentage of people who have played or watched esports reached a record high of 18.3%. In particular, interest in trying esports has increased among women aged 29 or younger.
- Smartphone Games Encourage “Communication” More Than “Getting Around”
- Playing smartphone games has led to an increase in cooperative play and conversations with friends, while the amount of time spent taking detours or going for walks has decreased.
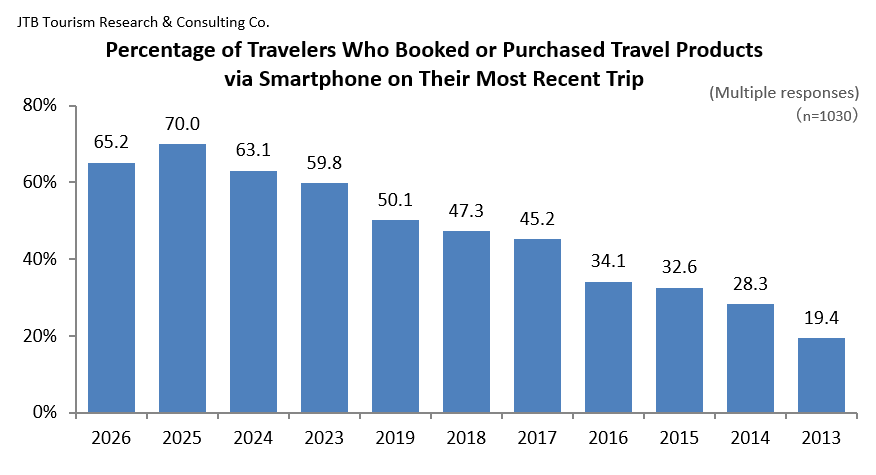
- The percentage of travel products purchased or booked via smartphones has declined for the first time since the survey began, signaling a shift in the previous growth trend.
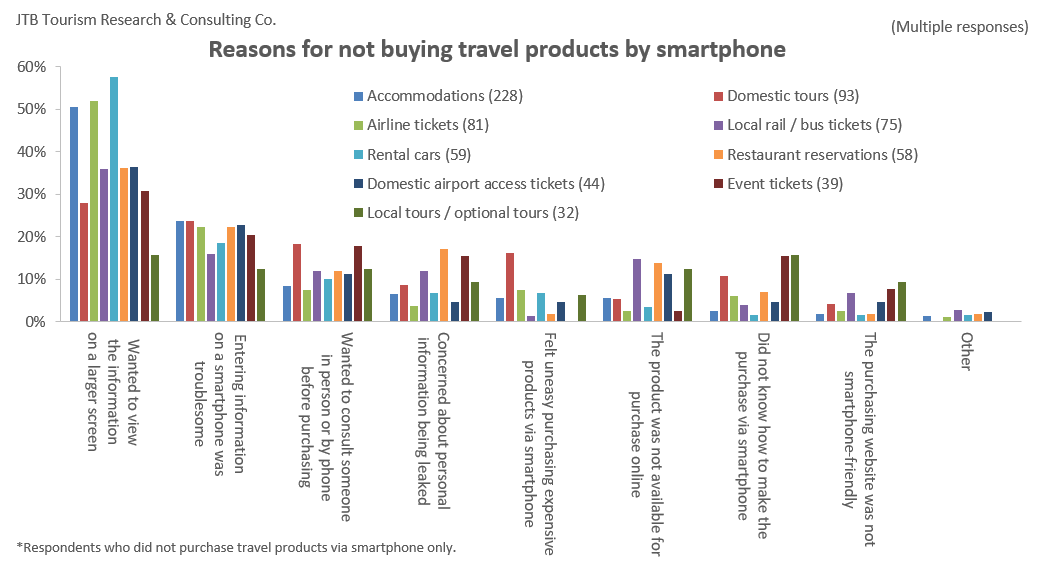
- Reasons for not making purchases on smartphones included “I wanted to view the information on a larger screen” and “It was a hassle to enter information on my smartphone.”
Actual Internet and Smartphone Usage Patterns
1. The use of “social media” as a frequently used smartphone feature has increased, while “messaging/chat,” “search engines,” “email,” and “map apps” show a downward trend
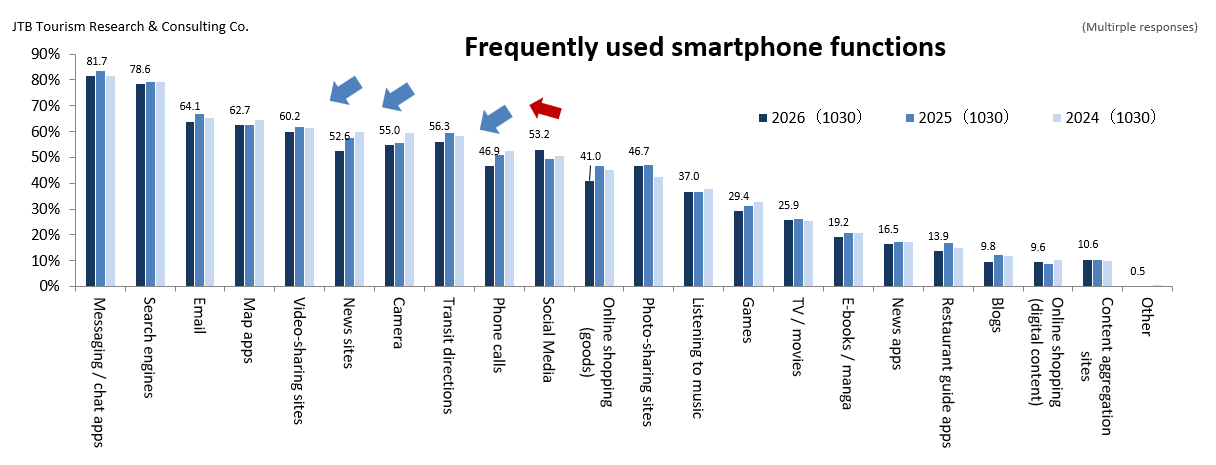
The top three most frequently used smartphone features remained the same as last year: “messaging/chat,” “search engines,” and “email.” However, usage rates for all three declined. “Map apps,” which had been on the rise in recent years, also saw a slight decline, while “social media” was the only category to show an increase (Figure 1).
(Figure 1)
2. Among social media platforms, Setlog usage exceeds 30% among women aged 29 or younger, surpassing BeReal’s 14.6%. While the top platforms remain unchanged, usage rates for LINE and YouTube have declined slightly
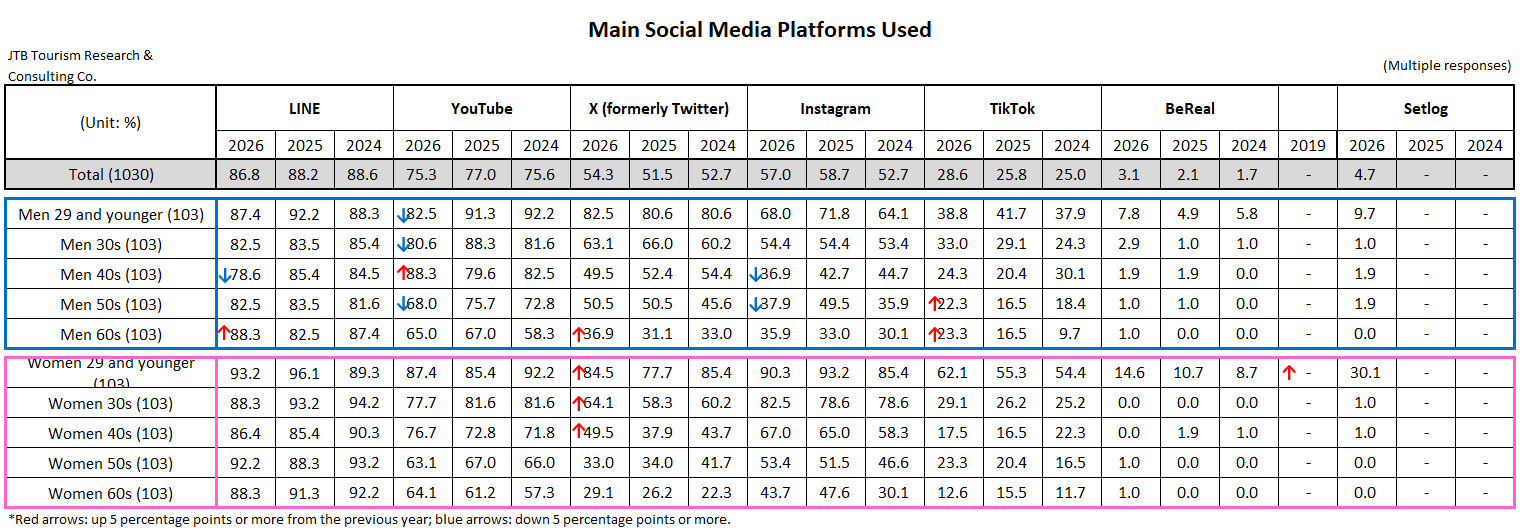
The main social media and video-sharing services used on smartphones were “LINE,” “YouTube,” “Instagram,” and “X.” While the top rankings remained unchanged from last year, usage rates for “LINE” and “YouTube” showed a slight downward trend. When broken down by gender and age group, “X” showed a recovery in usage among young women, while “TikTok” saw an increase in usage among men aged 50 and older. “Setlog,” which was included in the survey for the first time this year, had a usage rate of over 30% among women aged 29 or younger, exceeding that of “BeReal.” (Table 1)
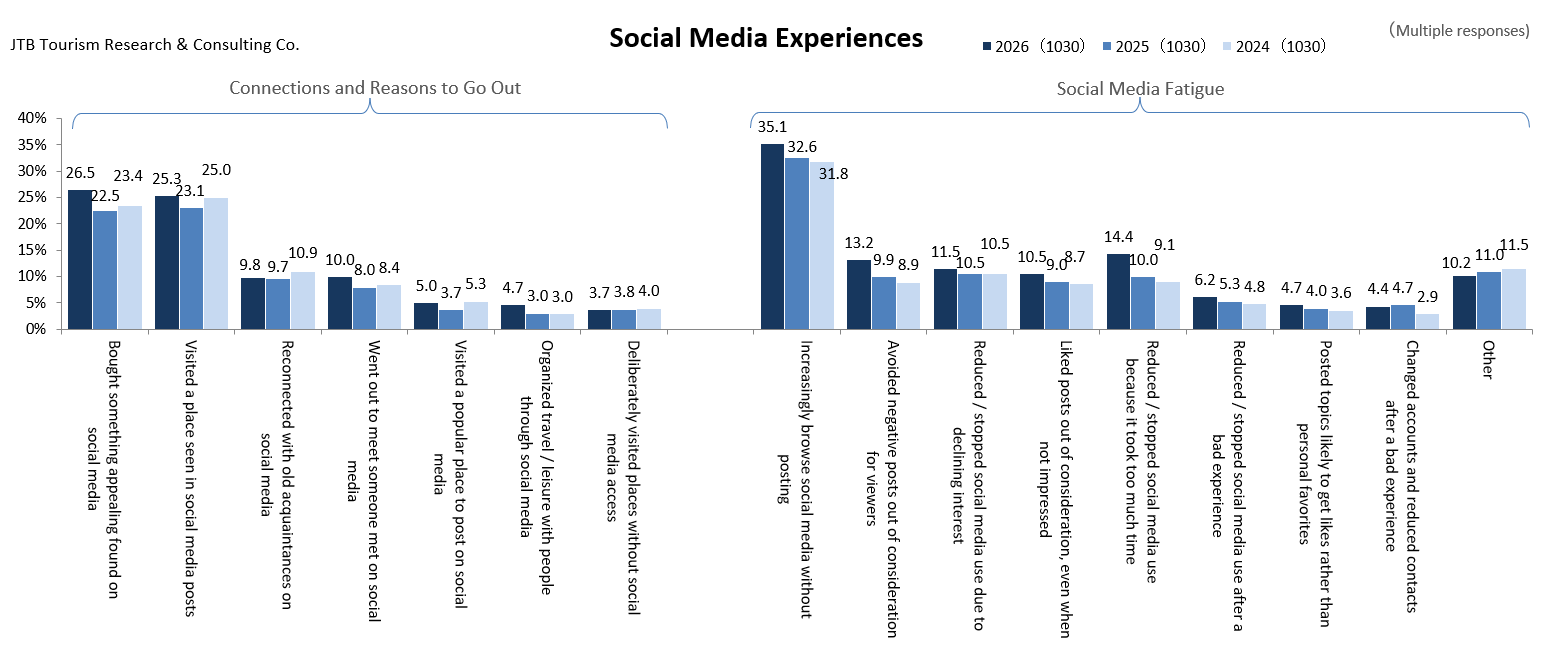
Regarding experiences with social media, the response “I just browse social media and no longer post” increased, indicating that the original role of “social networking” is weakening. However, the responses “I purchased something I liked after seeing it on social media” and “I visited a place I wanted to go to after seeing it in a social media post” both increased. This suggests that social media continues to serve as a catalyst for purchases and outings (Figure 2).
(Table 1)
(Figure 2)
3. The most frequently viewed video services, for both standard videos and short videos, are “YouTube” and “Instagram.” Women aged 29 or younger also watch short videos on “Setlog.” Compared with standard videos, short videos provide more opportunities to encounter “unexpected information.”
As social media continues to serve as a catalyst for purchases and outings, we focused on videos, one type of information encountered on social media, and asked respondents which services they use for both standard videos and short videos (vertical videos designed for smartphones that can be watched in a short amount of time, ranging from a few seconds to a few minutes), and for what purposes.
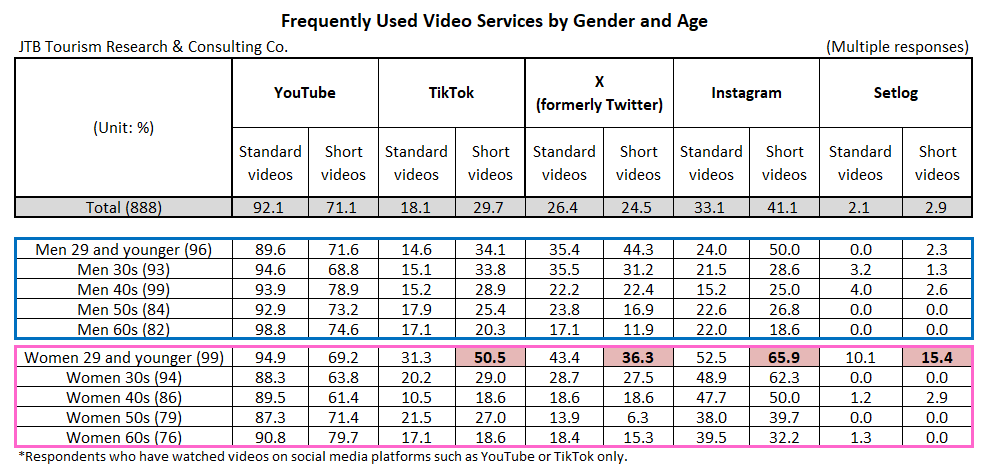
For both standard videos and short videos, “YouTube” was the most frequently used service, followed by “Instagram.” Third place went to “X” (26.4%) for standard videos and “TikTok” (29.7%) for short videos.
When broken down by gender and age group, women aged 29 or younger had a higher proportion of short-video viewers than the overall population, with “Instagram” at 65.9%, “TikTok” at 50.5%, and “X” at 36.3%. Furthermore, 15.4% watched short videos on “Setlog,” compared with 10.1% who watched standard videos. Together with the social media usage rates mentioned above, this suggests that Setlog is beginning to serve as a daily source of information for young women (Table 2).
(Table 2)
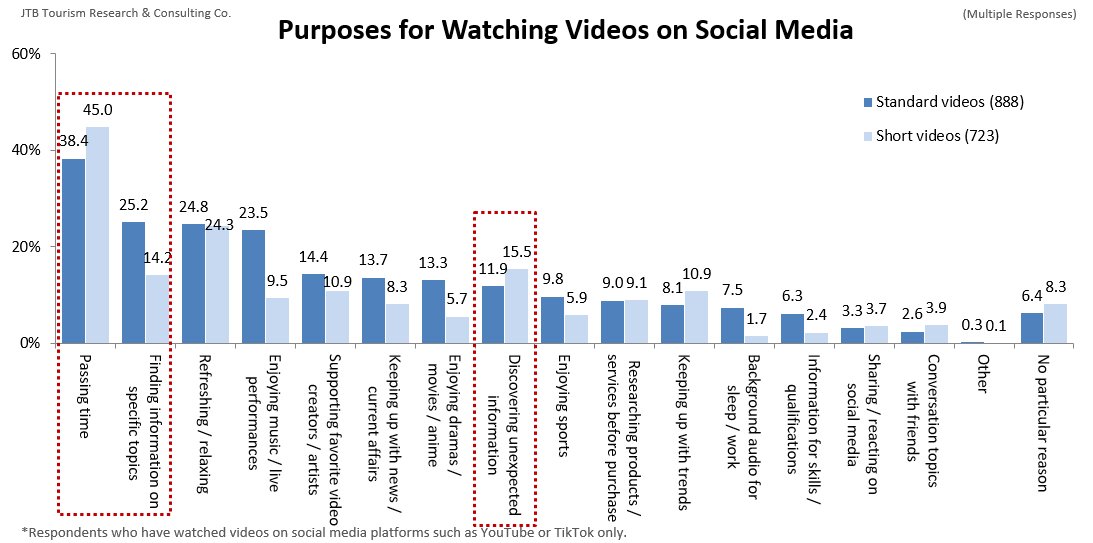
The most common purpose for watching videos, whether standard or short, was “to pass the time,” accounting for 38.4% for standard videos and 45.0% for short videos. In contrast, “gathering information of interest (information on specific genres)” accounted for 25.2% for standard videos and 14.2% for short videos. “Gathering unexpected information” accounted for 11.9% for standard videos and 15.5% for short videos (Figure 3).
While standard videos tend to be used to obtain detailed information on topics of prior interest, short videos are likely to be used not only to pass the time but also to encounter unexpected information while watching one video after another.
(Figure 3)
4. Among those who watch social media videos for 2 to 4 hours a day, 28.2% have visited a location featured in a video.
“Learn about it in a video, then check it out in person.” Digital videos encourage real-world visits
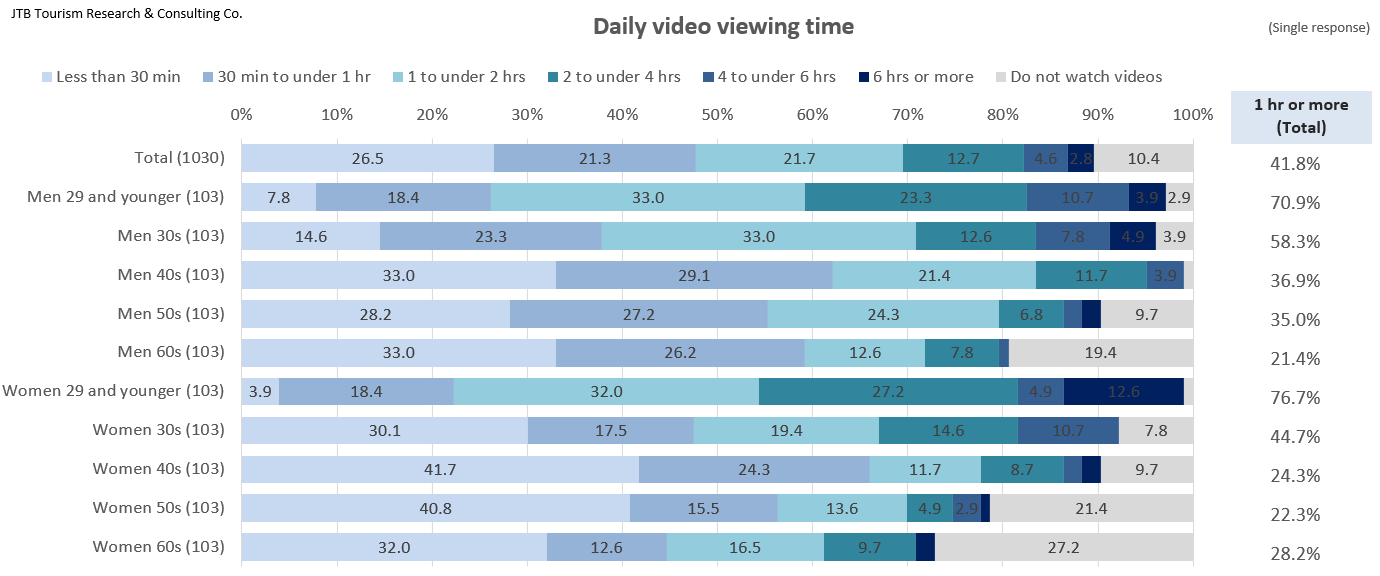
Next, we examined how exposure to videos relates to interest in places and experiences, as well as visits to those locations. When asked about the amount of time spent watching videos on social media platforms such as YouTube and TikTok each day, 41.8% of respondents reported watching for one hour or more. Breaking this down by gender and age group, among those aged 29 or younger, 70.9% of men and 76.7% of women watched for one hour or more, with both groups exceeding 70%. Notably, 17.5% of women watched for four hours or more per day (Figure 4).
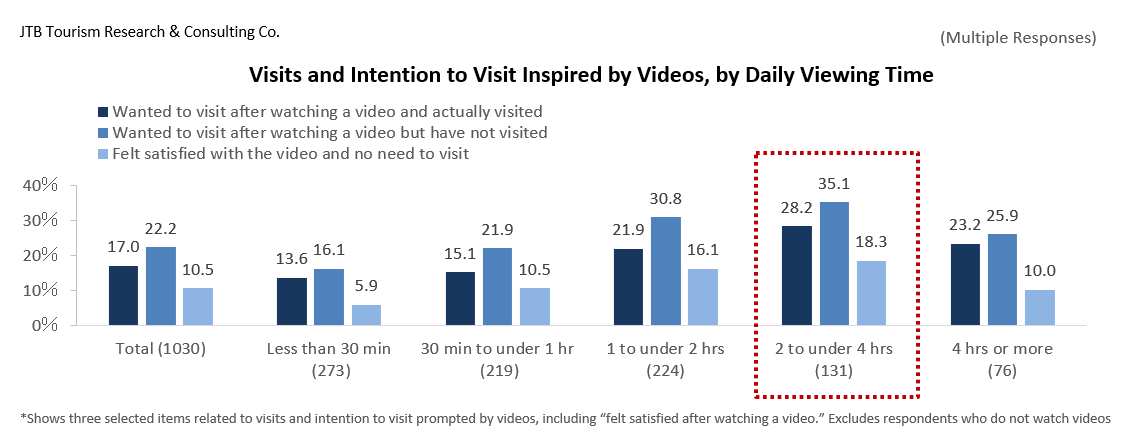
Regarding the relationship between exposure to social media videos and places or experiences, 17.0% of respondents said that watching footage of a place or event online prompted them to “want to go there and visit it,” exceeding the 10.5% who said they “felt satisfied just by watching the video and didn’t feel the need to go there.”
Among respondents who said they “wanted to visit that place and actually went there,” the percentage was 13.6% among those who watched social media videos for “less than 30 minutes,” 15.1% among those who watched for “1 hour or more but less than 2 hours,” and 28.2% among those who watched for “2 hours or more but less than 4 hours.” This suggests that the longer people spend watching social media videos, the more likely they are to visit locations featured in those videos (Figure 5).
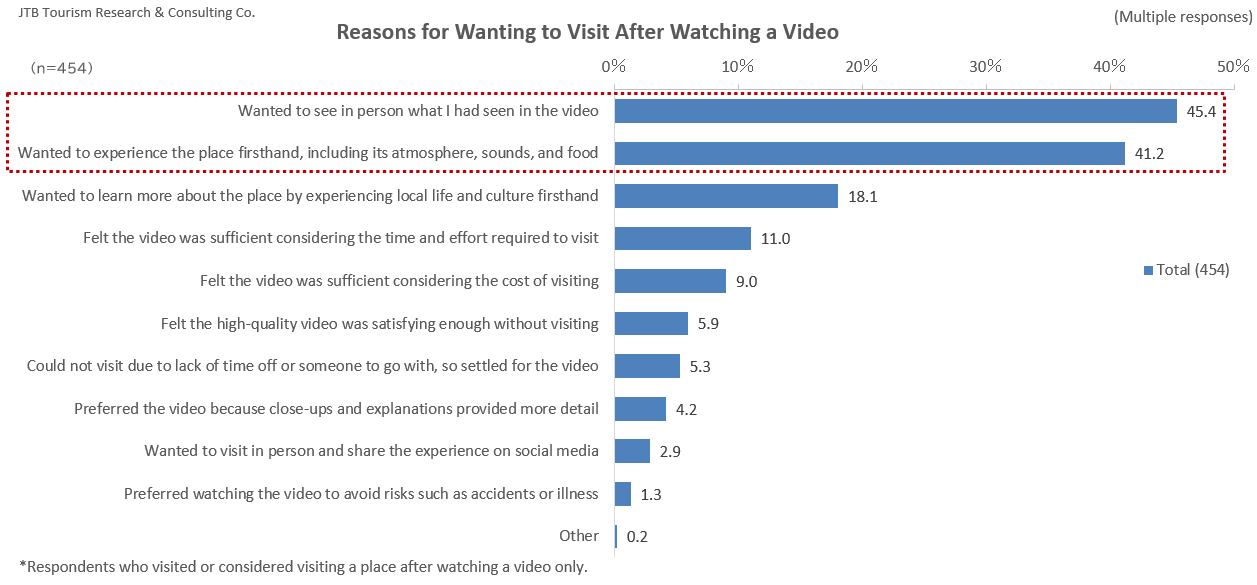
As for the reasons for visiting, 45.4% cited “I wanted to see what I saw in the video in person and confirm the real thing,” while 41.2% cited “I wanted to feel the atmosphere and sounds of the place, enjoy the food, and experience it firsthand” (Figure 6).
As social media videos become a daily source of information, digital videos not only provide information about places and experiences but can also encourage real-world visits. Even as people gain detailed insights into what a location is like, their interest in seeing it firsthand and experiencing it through their five senses remains strong. This suggests that the key to turning digital touchpoints into real-world visits and interactions lies in using both standard and short videos to introduce places and experiences while clearly communicating the unique value that can only be experienced at those locations.
(Figure 4)
(Figure 5)
(Figure 6)
Changes in Daily Life and Trends in AI Use
5. Changes in daily life over the past year or so: “Using AI on a daily basis” and “Making purchases using methods other than cash” have increased. Meanwhile, personal phone calls, emails, and watching TV at scheduled broadcast times have decreased
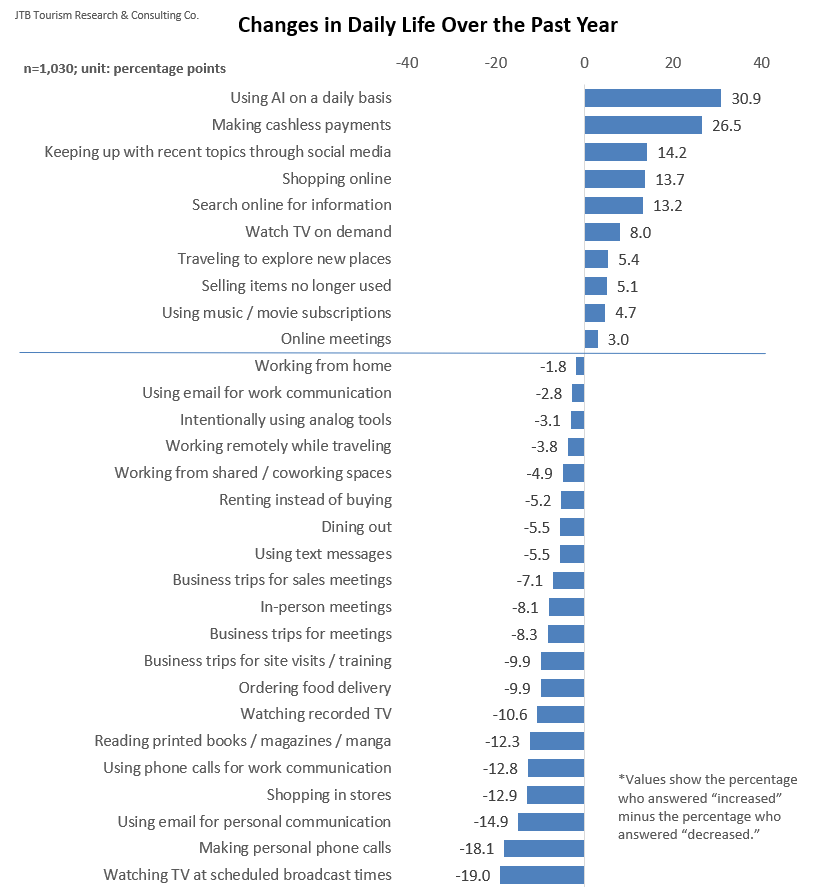
In daily life, the percentage of respondents reporting an increase in “using AI on a daily basis” and “making purchases using methods other than cash” (calculated by subtracting the percentage of “decreased” responses from the percentage of “increased” responses) was notably high, indicating that the daily use of AI and cashless payments has become even more widespread.
On the other hand, activities such as “exchanging personal emails,” “making personal phone calls,” and “watching TV at scheduled broadcast times” have decreased, offering a glimpse into changes in lifestyles during the Reiwa era (Figure 7).
(Figure 7)
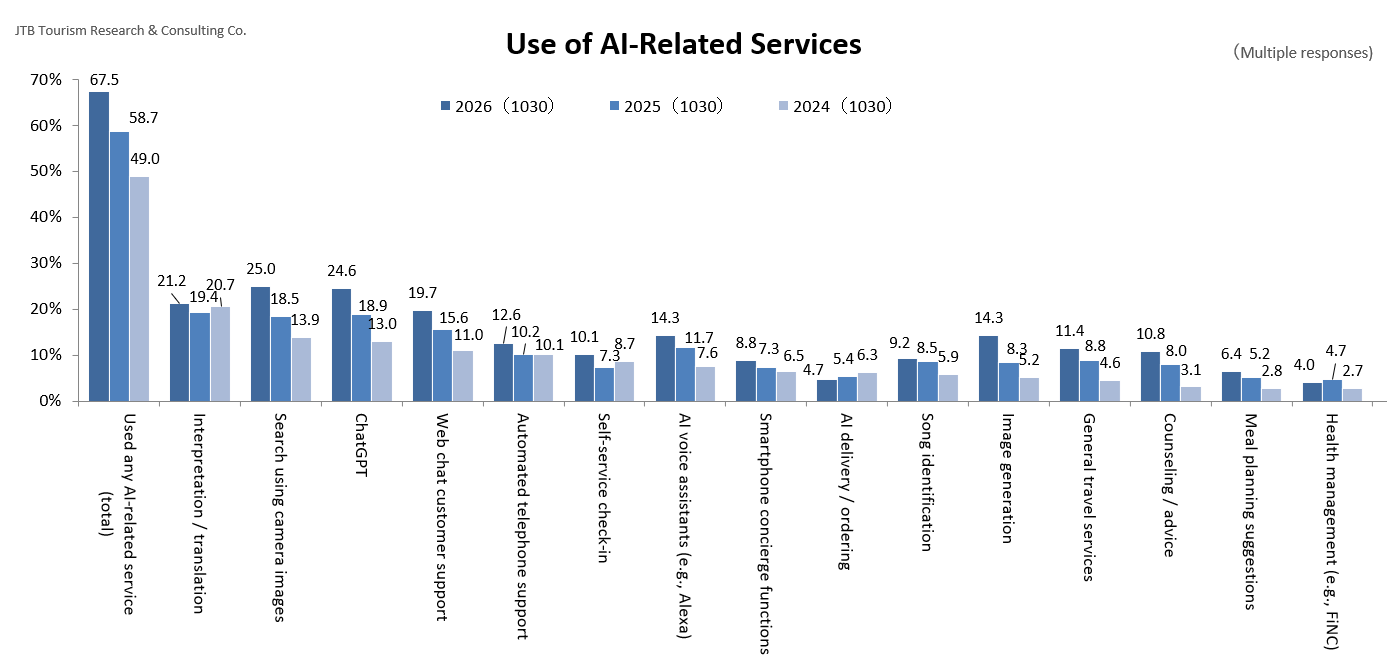
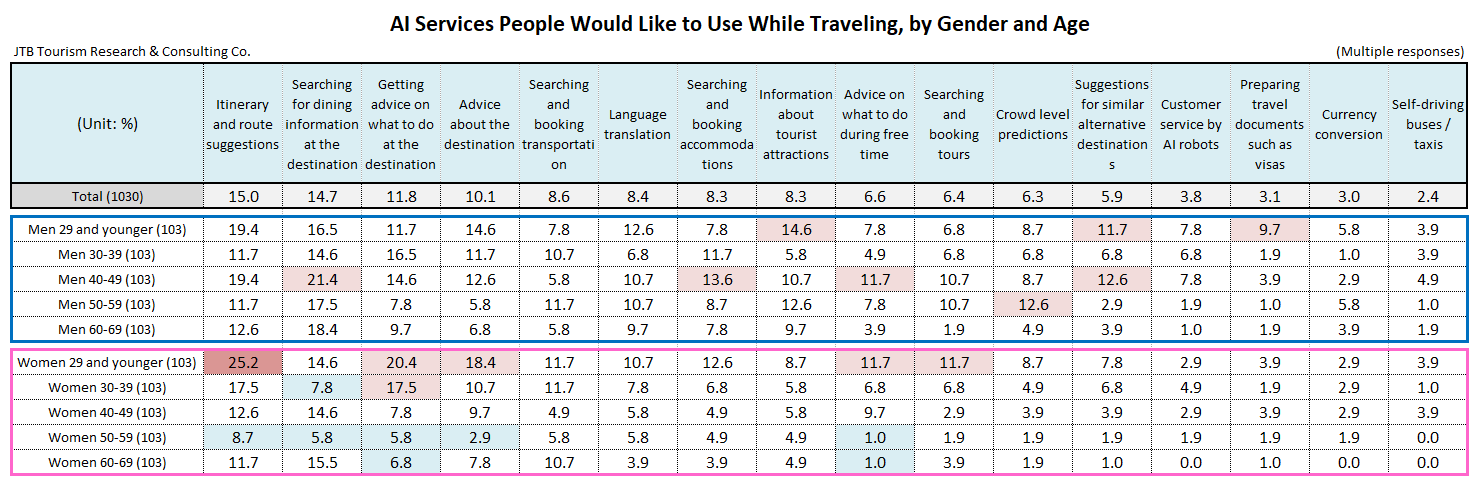
6. Usage of AI-related services rose to 67.5%, up 8.8 percentage points from last year. The use of AI for information searches, such as “asking generative AI questions,” “searching using images or audio,” and “asking a voice assistant,” has increased, while the use of search engines and map apps has declined. Among AI services people would like to try while traveling, “itinerary and route suggestions” (15.0%) ranked first, followed by “searching for dining information at travel destinations” (14.7%) and “getting advice on what to do at travel destinations” (11.8%).
Usage of AI-related services overall rose by 8.8 percentage points from last year, reaching 67.5%, or nearly 70%. Regarding methods of information search, the use of AI-powered search methods, such as “searching using images or audio” and “asking a voice assistant,” continued to rise (Figures 8–9). *“AI-related services” include generative AI, voice assistants, and searches using images or audio clips.
(Figure 8)
(Figure 9)
The AI services people would most like to use while traveling are “itinerary and route suggestions” (15.0%), followed by “searching for dining information at the destination” (14.7%) and “getting advice on what to do at the destination” (11.8%). These results suggest that interest in using generative AI while traveling is growing. When broken down by gender and age group, women aged 29 or younger showed particularly strong interest in using generative AI for “advice on what to do at the destination,” “advice on the destination itself,” and “advice on what to do when they have free time” (Table 3).
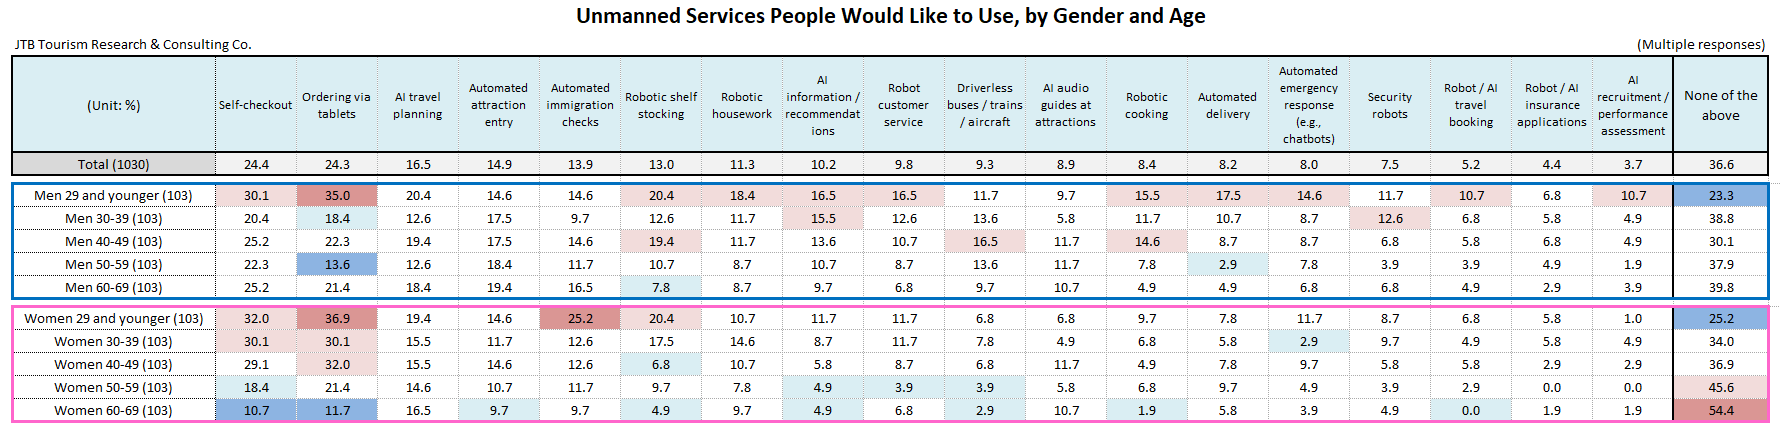
Regarding interest in using “unmanned services” (not limited to AI), “AI-generated travel itinerary planning” (16.5%) ranked third, surpassing “automated immigration checks” (13.9%), after “automated checkout” (24.4%) and “ordering via tablets or similar devices” (24.3%) (Table 4).
(Table 3)
(Table 4)
7. 38.7% of people who use generative AI daily view it as a “good advisor” or a “trustworthy friend”
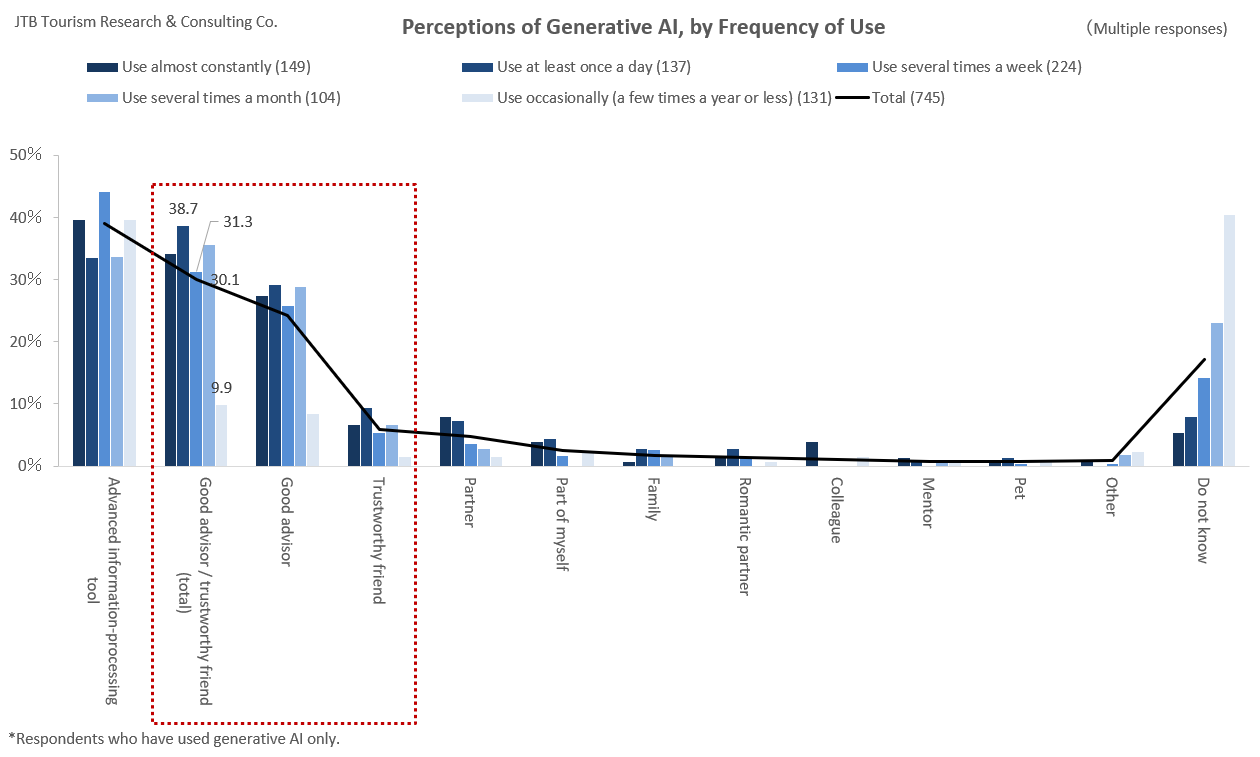
Amid growing interest in AI-powered services, such as seeking advice while traveling or creating travel plans, we examined how people who use generative AI on a daily basis perceive the technology. Among those who use generative AI at least once a day, 38.7% view it as a “good advisor” or “trustworthy friend,” while 31.3% of those who use it several times a week share this view. In contrast, only 9.9% of those who use it a few times a year or less share this view (Figure 10).
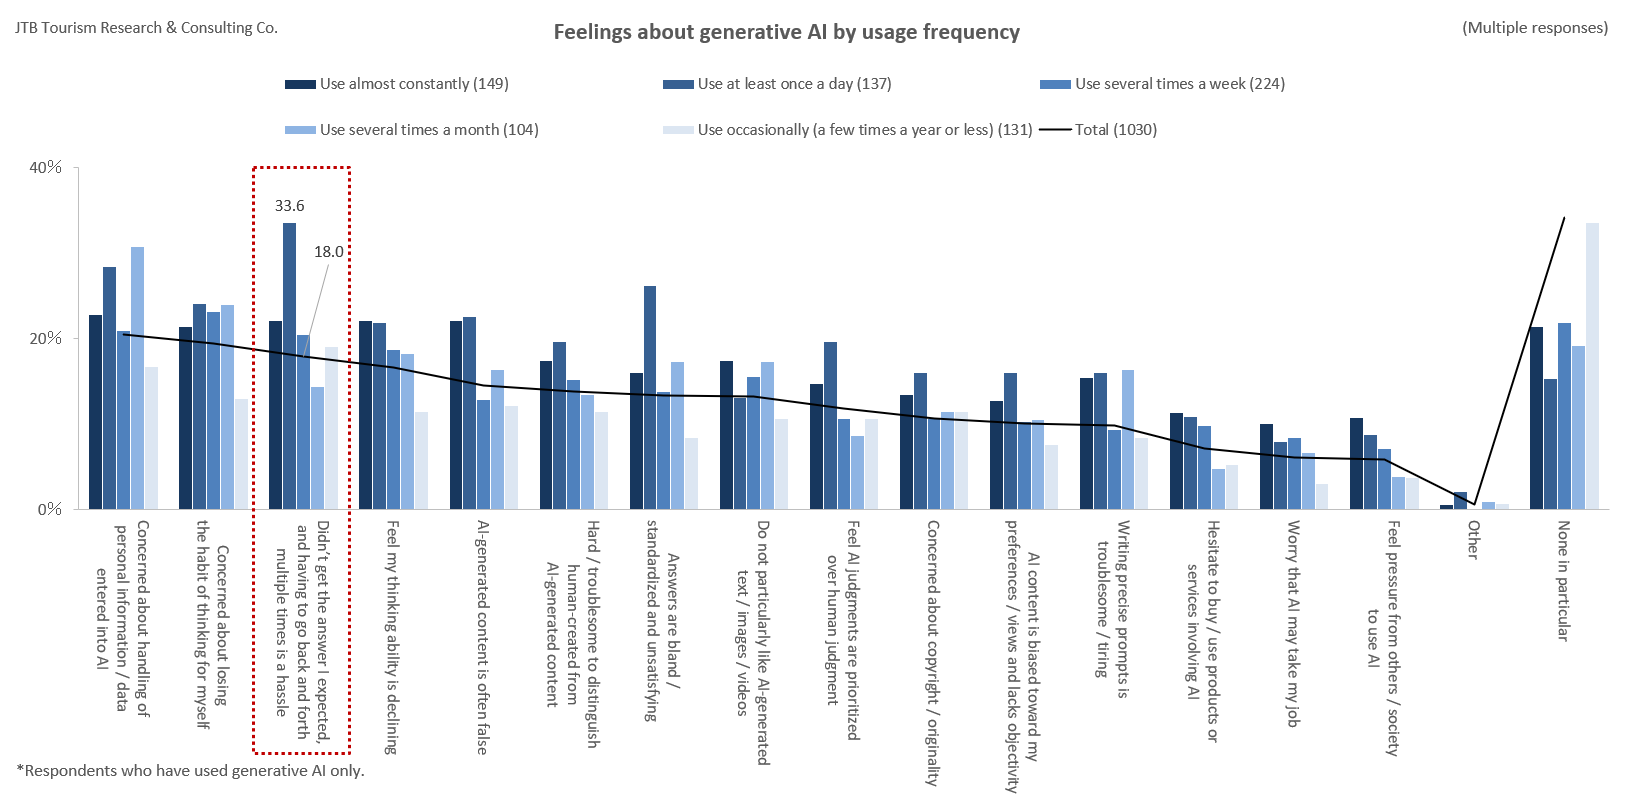
This suggests that, for some frequent users, generative AI has evolved beyond being merely a tool for processing information to become a resource they turn to for questions and concerns. On the other hand, while 18.0% of respondents overall said, “I didn’t get the answer I expected, and having to go back and forth multiple times is a hassle,” this figure rose to 33.6% among those who use generative AI at least once a day (Figure 11).
Generative AI is becoming a familiar resource that supports information gathering and decision-making. At the same time, as its use becomes part of everyday life, frustrations such as the effort required to obtain the desired response are also beginning to emerge.
(Figure 10)
(Figure 11)
Behaviors and Mindsets Related to Smartphone Games
8. While smartphone games have led to an increase in cooperative play and conversations with friends, activities such as taking detours or going for walks have decreased
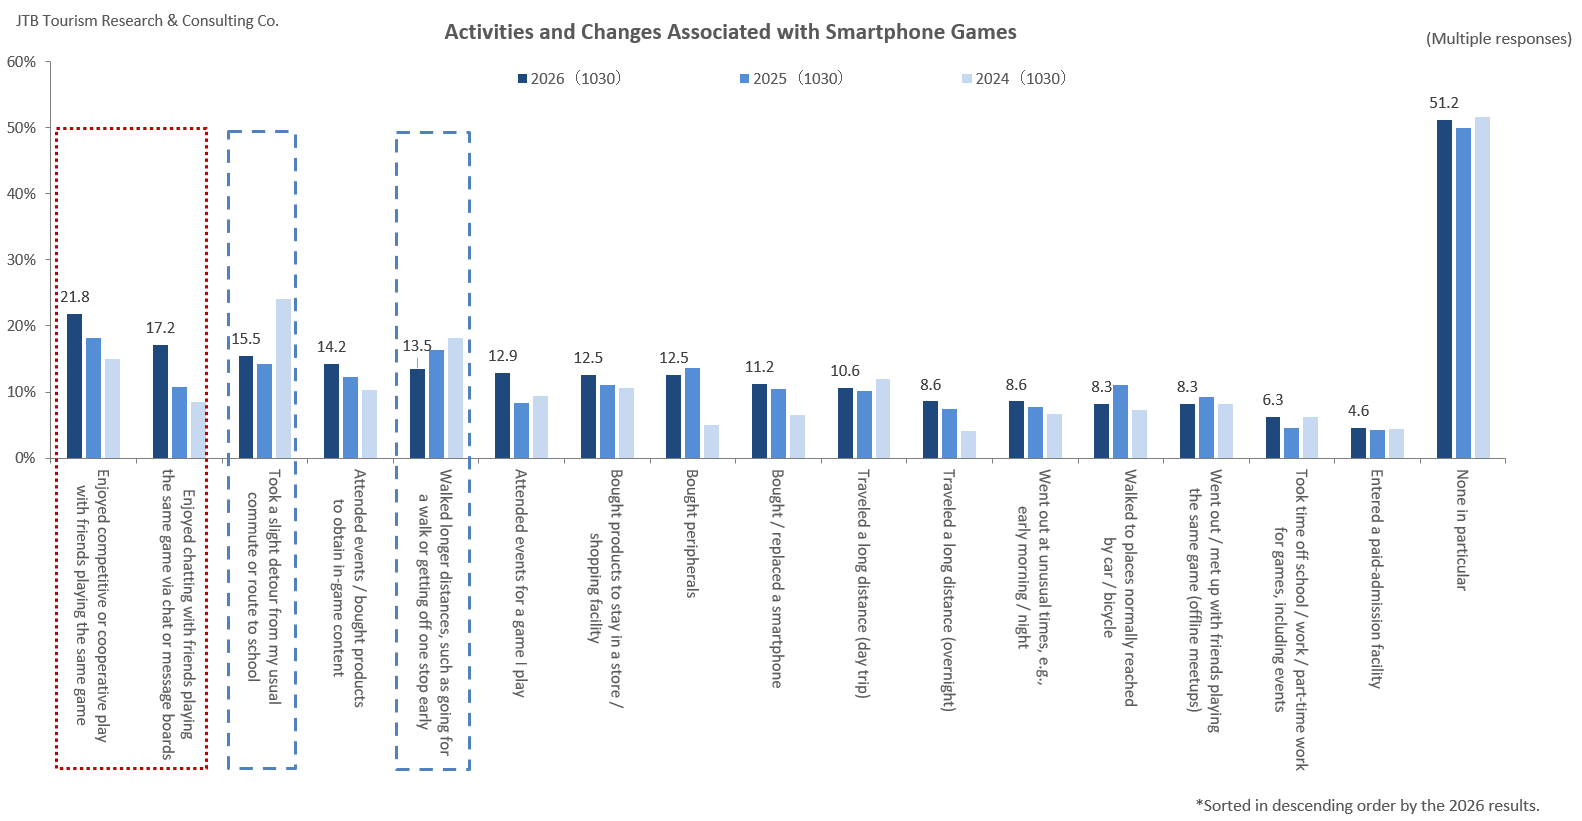
Regarding activities and changes associated with smartphone games, responses such as “I enjoyed competitive or cooperative play (multiplayer) with friends playing the same game” (21.8%) and “I enjoyed chatting with friends playing the same game via chat or message boards” (17.2%) have increased year by year (Figure 12). While smartphone games are often associated with “playing alone in your spare time,” these results suggest that communication has become an increasingly important aspect of smartphone gaming in recent years.
On the other hand, the percentages for “Taking a slight detour from my usual commute or route to school” (15.5%) and “Walking longer distances, such as going for a walk in a nearby park or getting off one stop early and walking the rest of the way” (13.5%) have decreased since 2024. While game apps linked to location data and step counters once encouraged people to move around, these results suggest that the ways smartphone games influence people’s behavior may be gradually changing.
(Figure 12)
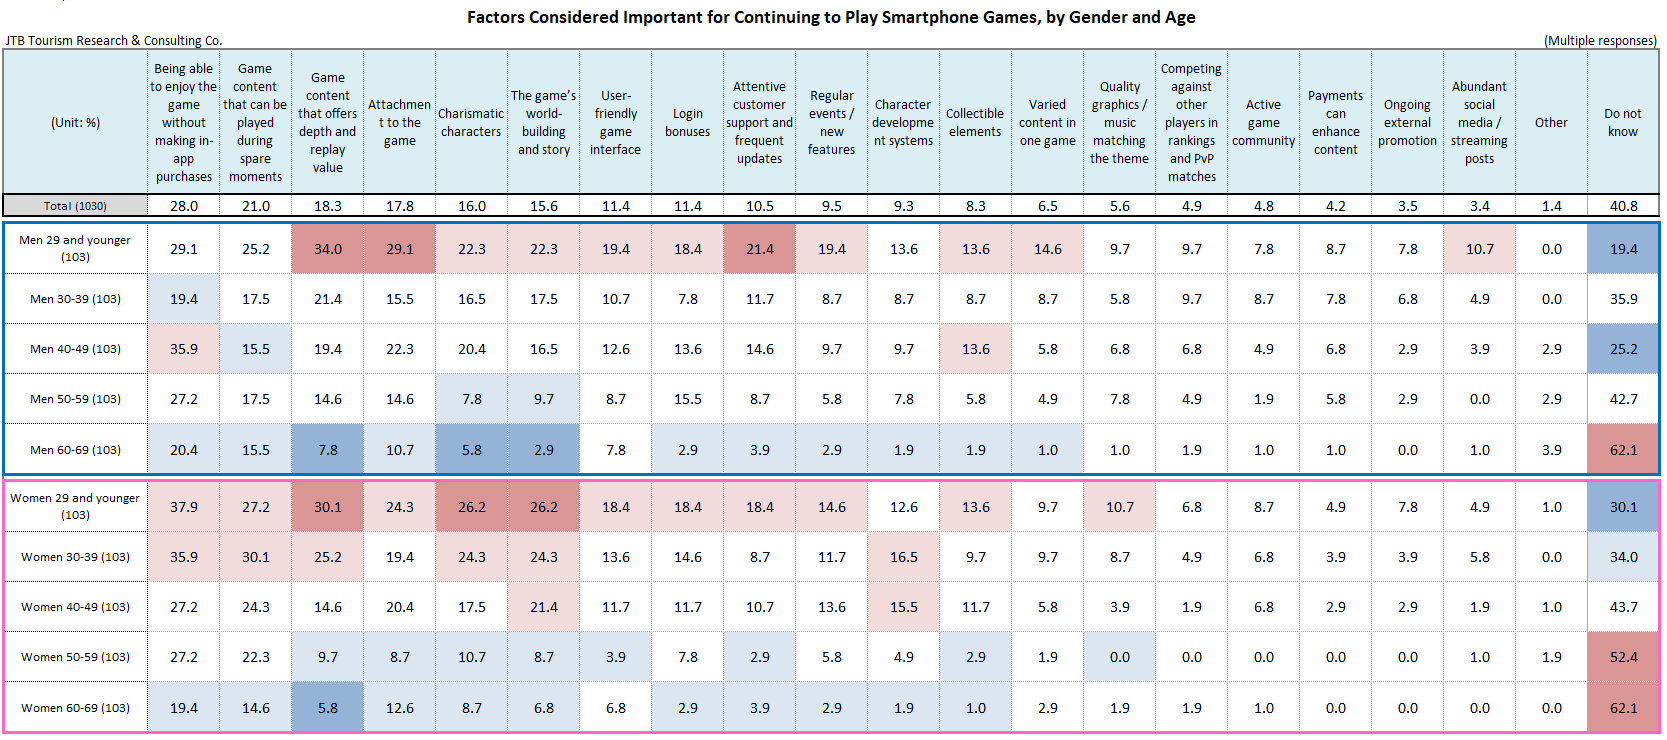
Next, we asked about the factors considered important for continuing to play smartphone games over the long term. Overall, “being able to enjoy the game without making in-app purchases” (28.0%) and “game content that can be played during spare moments” (21.0%) ranked highest. This suggests that games that do not require significant amounts of time or money are more likely to be played over the long term (Table 5).
Looking at differences by age group, among younger players aged 29 or younger, both men and women placed greater importance on “game content that offers depth and replay value.” However, differences were observed between men and women. Men aged 29 or younger placed greater importance on factors beyond the game itself, such as “attachment to the game” and “attentive customer support and frequent updates,” while women in the same age group prioritized in-game elements such as “charismatic characters” and “the game’s world-building and story.” Thus, even within the same younger age group, the elements considered important differed between men and women.
(Table 5)
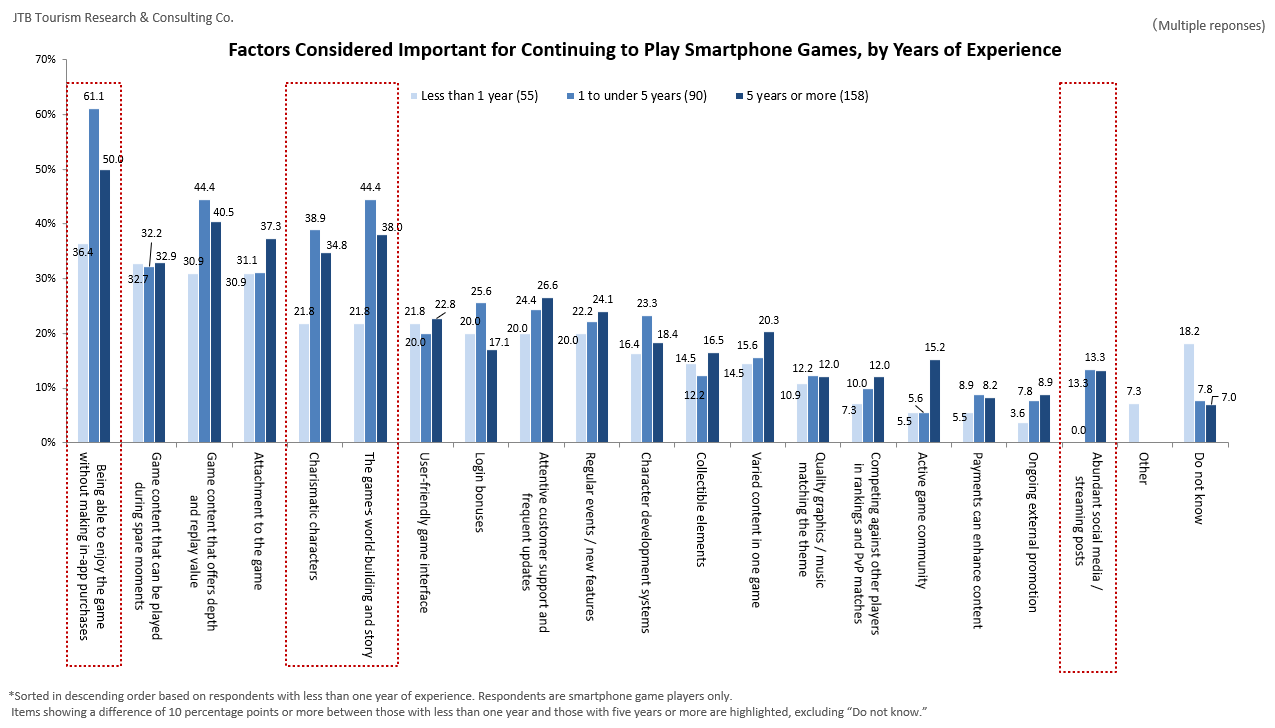
Furthermore, when analyzing the data by respondents’ experience playing smartphone games, those with more years of experience tended to place greater importance on factors such as “being able to enjoy the game without making in-app purchases,” “compelling characters,” “gameplay that offers plenty to explore,” and “competing against other players in rankings and PvP matches” (Figure 13).
(Figure 13)
Interest in and Experience with Esports
9. The percentage of people who have played or watched esports reached a record high of 18.3%. Engagement with and interest in esports are increasing among young women
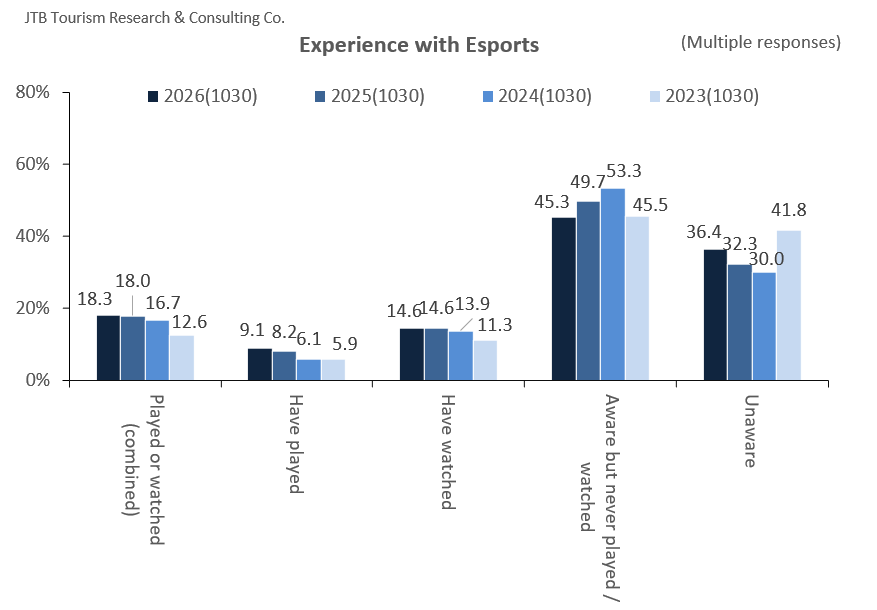
Looking at experiences related to esports, the percentage of respondents who answered “I don’t know” increased from 32.3% to 36.4% compared with last year, while overall awareness of esports declined for the second consecutive year. This suggests that the expansion of esports awareness across society may be leveling off for the time being.
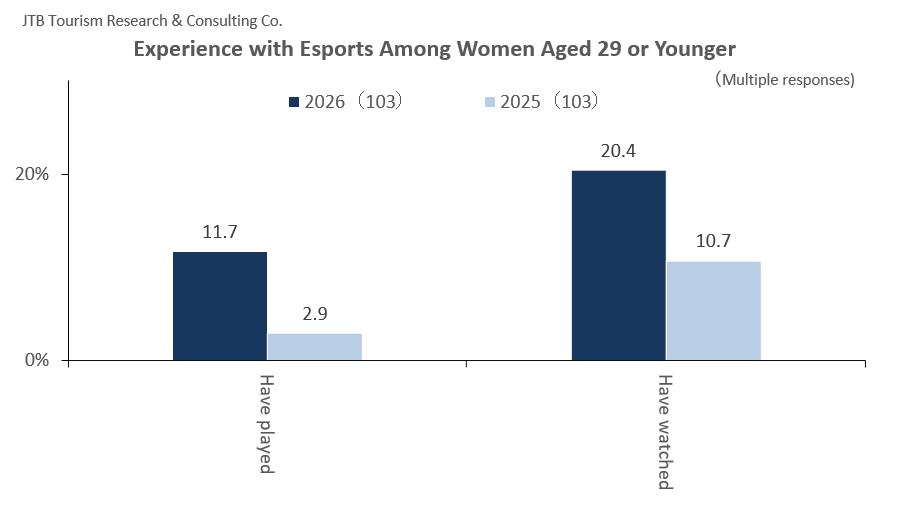
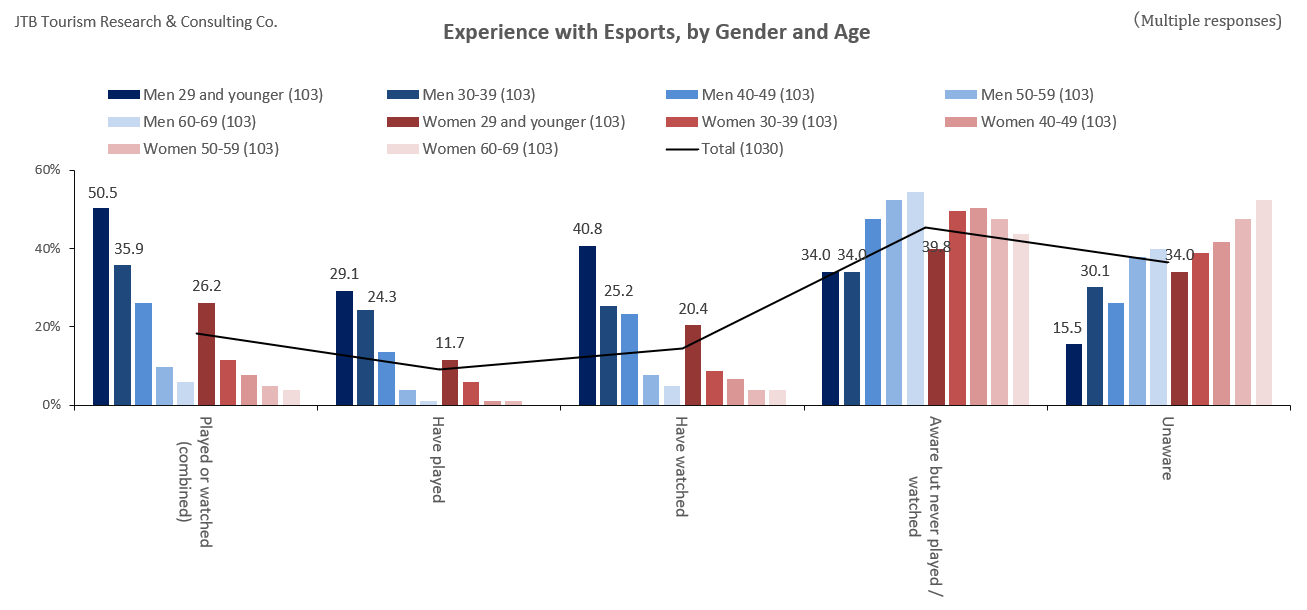
On the other hand, the percentage of people who have played or watched esports increased for the third consecutive year, reaching a record high of 18.3% since the survey began. When broken down by gender and age group, experience with playing or watching esports was highest among men aged 29 or younger (50.5%), followed by men in their 30s (35.9%) and women aged 29 or younger (26.2%). Among women aged 29 or younger in particular, the percentages who had played and watched esports increased from 2.9% to 11.7% and from 10.7% to 20.4%, respectively, compared with last year. Although there has been no significant change in the overall percentage of people who have played or watched esports, these results suggest that notable shifts may be taking place within individual demographic groups.
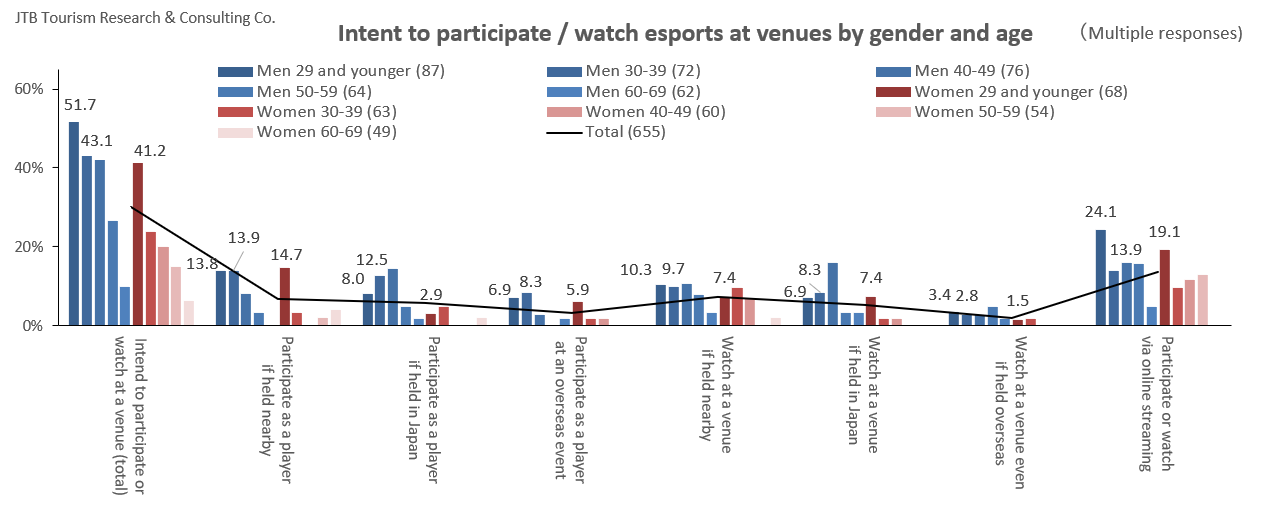
Furthermore, among respondents aged 29 or younger who were “familiar with” esports, 41.2% of women said they intended to visit a venue to play or watch esports, a significant increase from 32.7% last year (Figures 14–17).
(Figure 14)
(Figure 15)
(Figure 16)
(Figure 17)
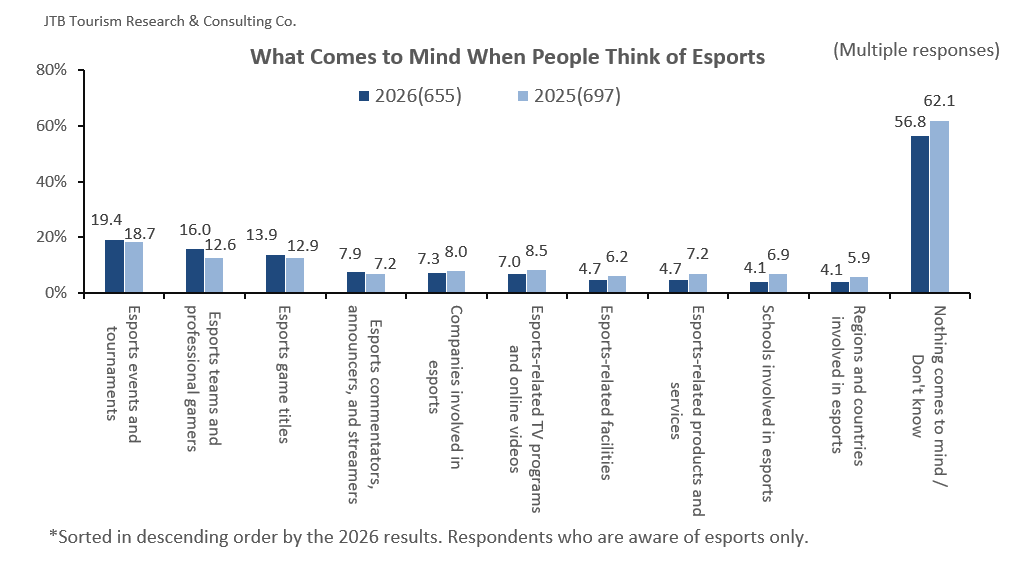
When asked what specifically comes to mind when they hear “esports,” “esports events and tournaments” (19.4%) ranked highest overall, as it did last year. The percentage of respondents who answered “I can’t think of anything” or “I don’t know” decreased from 62.1% last year to 56.8%, suggesting that among those who are aware of esports, a more concrete image of esports is gradually taking shape (Figure 18).
(Figure 18)
Furthermore, focusing on women aged 29 or younger, who showed a significant increase in experience with and interest in playing or watching esports as mentioned earlier, the percentage who associated esports with “esports teams and professional gamers” increased substantially from last year (Figure 19). This suggests that growing interest in esports teams and professional gamers may be contributing to increased engagement with esports among women aged 29 or younger.
In the 2024 survey, young women showed strong interest in following video creators and live streamers on social media and purchasing related merchandise, highlighting the prevalence of so-called “oshi-katsu” (activities that involve supporting one’s favorite creators or personalities). In the same survey, “because my favorite video creators or live streamers were playing” was the most commonly cited reason for watching esports, suggesting a close connection between video creators, live streamers, and esports. Comparing these past findings with the latest survey suggests that the range of “favorite” figures people support may be expanding beyond video creators and live streamers to include professional gamers.
(Figure 19)
Use of Travel-Related Products and Services
10. The percentage of travelers purchasing or booking travel products via smartphone has declined for the first time since the survey began, signaling a shift in the previous growth trend. Reasons for not making purchases via smartphone included “I wanted to view the information on a larger screen” and “It was a hassle to enter information on a smartphone.”
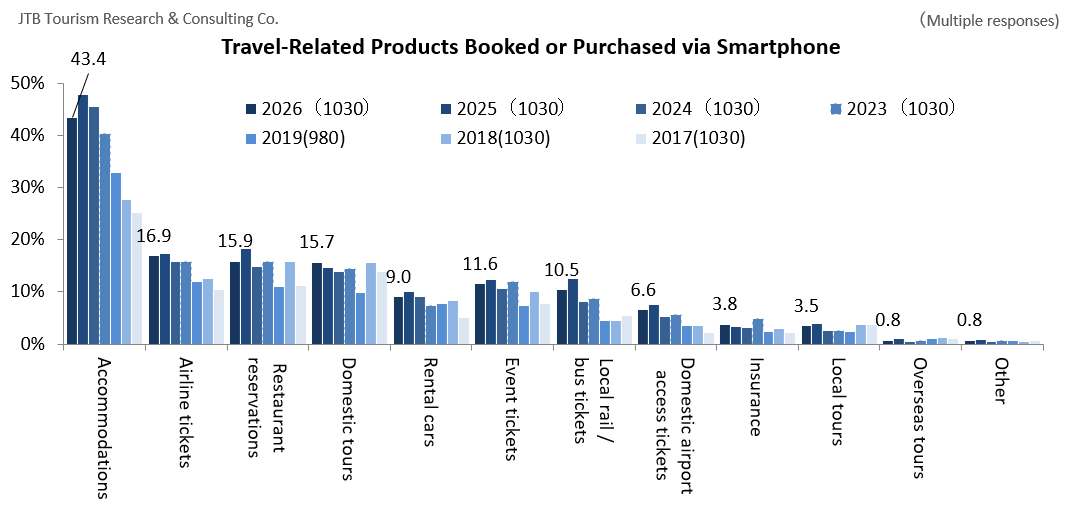
The percentage of reservations and purchases of travel-related products made via smartphone declined for the first time since the survey began in 2013 (Figure 20). Among travel-related products purchased, “accommodations” continued to account for the highest percentage, although this figure decreased from last year (Figure 21).
Reasons for not making reservations or purchases via smartphone varied by product category, but for “rental cars,” “airline tickets,” and “accommodations,” “I wanted to view the information on a larger screen” was cited as a reason (Figure 22). For items where consumers wish to compare various options before making a decision, a smartphone’s small screen may not be sufficient.
(Figure 20)
(Figure 21)
(Figure 22)
Summary
As AI Becomes the “Default” in Everyday Life, Frustrations with Its Use Are Also Growing
Last year’s survey showed that the rapid spread of generative AI was significantly changing the way people gather information, from traditional “searching” to “consulting” generative AI. This year’s findings suggest that AI has become even more deeply integrated into everyday life, with some users now viewing it as a “trusted advisor.” At the same time, more frequent users are also reporting specific frustrations, such as “not getting the expected answers” and “finding repeated back-and-forth exchanges tedious.”
While some of these frustrations may be addressed as AI continues to evolve, other concerns also ranked highly, including “anxiety about how personal information and data entered into AI are handled,” “a sense of concern about no longer thinking for oneself,” and “a dislike of text, images, and videos generated by AI.” Going forward, finding the right balance in how we engage with AI is likely to become increasingly important.
Toward an Era of Learning Digitally and Experiencing in Person
As social media videos become a daily source of information, this survey reaffirmed that even as people gain increasingly detailed information about local conditions online, their interest in seeing places for themselves and experiencing them through all five senses remains strong.
The survey also found that standard-length videos tend to deepen interest and understanding among people who are already interested in a particular place or experience, while short videos can spark new interest among those who are not yet familiar with it. By using the appropriate touchpoints to communicate to the right audiences at each stage of the decision-making process, while highlighting the unique value that can only be experienced in person, digital interactions can lead to real-world visits and engagement.
Smartphone Games Are Increasingly Seen as “Tools for Communication with Friends”
This survey revealed that while there is demand for games that can be enjoyed for free during spare moments, there is also a growing tendency to “collaborate and communicate with friends” through smartphone games. If this trend continues, game developers will likely need to take these changing patterns of play into account when developing and marketing games. The “Public-Private Investment Roadmap for Key Products, Technologies, etc. in 17 Strategic Sectors,” published by the Cabinet Secretariat in July 2026, included the gaming sector and specifically emphasized support for the growth of smartphone games. Attention is now focused on how smartphone games will continue to evolve.
Furthermore, while awareness of esports across society as a whole appears to have leveled off for the time being, this survey highlighted shifts in the composition of the esports community, as seen in the increasing number of young women with experience playing or watching esports. These findings suggest that esports may be reaching a turning point.