Human Flow Data Comes Alive When Layered: Unlocking Data's value Increases Through Combination

Many regions have introduced human flow data, only to find themselves wondering, "How should we actually use this?" The value of data grows not when it stands alone, but when it is combined with other information. This article introduces how human flow data can be used for identifying issues and supporting decision-making at tourist destinations—by layering it with diverse data such as survey results, transportation, and disaster prevention on a GIS—drawing on concrete analytical examples.
1. Introduction
In recent years, human flow data has been attracting growing attention in the formulation of tourism strategies. Human flow data is data that quantitatively captures "when, where, who, and how people moved." Where do the people who visit a tourist destination come from, where do they go, and where do they linger? Human flow data, which visualizes these movements, offers valuable clues for developing tourism strategies. However, human flow data alone cannot reveal everything about visitors' reasons for their behavior or a region's challenges. What matters is combining and analyzing various types of information—such as survey results, tourist facilities, transportation, and disaster prevention—according to the purpose of the analysis. This article introduces how, rather than analyzing human flow data on its own, combining it with a variety of information can be applied to decision-making at tourist destinations, along with concrete analytical examples.
2. What Is Human Flow Data in the Tourism Field? —The Strengths and Limitations of Human Flow Data—
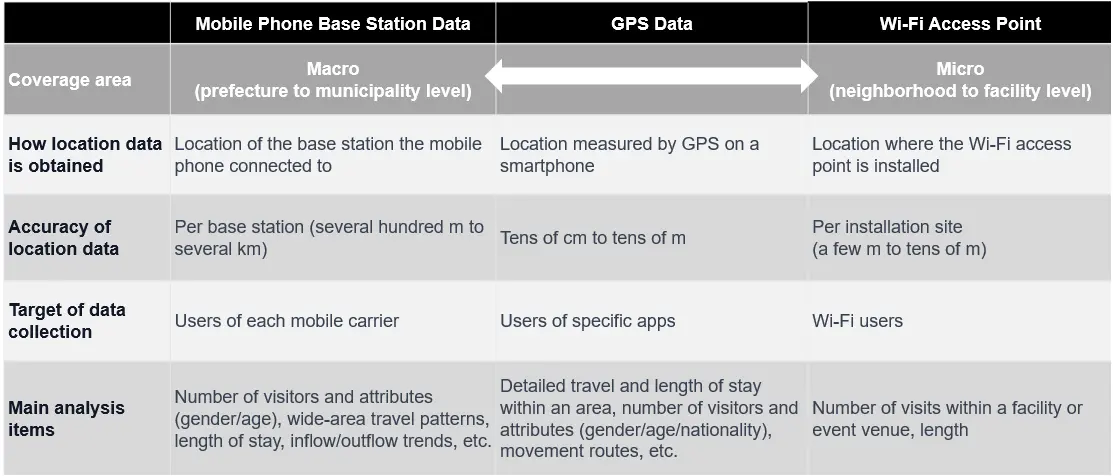
Representative types of human flow data used in the tourism field include mobile phone base station data, GPS data obtained through specific apps, and Wi-Fi access point connection data (Table 1). Human flow data varies in its characteristics and the items it can analyze depending on how it is collected, so it is important to understand the properties of each type when using it.
Table 1: Main Types of Human Flow Data Used in the Tourism Field and Their Characteristics
When people think of human flow data, many likely picture the big data collected through IoT devices, as mentioned above. However, statistical data such as 1person trip surveys based on traditional questionnaire surveys also track people's movements, and in a broad sense can be regarded as human flow data. So, where do the differences lie between so-called human flow big data obtained from IoT devices and traditional statistical data based on questionnaire surveys and the like?
The first difference that comes to mind is the volume of data. Human flow big data sometimes involves analyzing log data amounting to billions of records. The ability to continuously and efficiently obtain and analyze large-scale data that was impossible with traditional questionnaire surveys is a major advantage of human flow big data. What about in terms of data quality? Human flow big data automatically collects the location information of the target IoT devices in units of latitude and longitude, so—depending on the type of data—analysis at the level of a few minutes or tens of meters is theoretically possible. In this respect, its ability to capture people's movements over a wide area and in detail can be said to be superior to traditional questionnaire surveys. However, the information obtainable from IoT devices centers on quantitative information such as location and time, and it is not easy to grasp qualitative information such as a person's motivation for moving or the underlying preferences behind it. On the other hand, with traditional statistical data based on questionnaire surveys, by adding survey items, it is relatively easy to obtain not only motivations and preferences but also personal data such as family composition and annual income.
In this way, even analysis using large-scale human flow big data has limits to the insights it can yield. What is effective in compensating for these limitations of human flow big data and enhancing its value is GIS (Geographic Information System). By using GIS, various types of information can be layered on a digital map to analyze the background and factors that human flow data alone cannot capture. Note that, hereafter in this article, human flow big data obtained through IoT devices—such as mobile phone base station data, GPS data, and Wi-Fi access point data—will be referred to simply as "human flow data."
1 A Person-Trip Survey (PT Survey) is a survey that asks urban residents about their daily travel patterns, with the aim of understanding “what kinds of people” are traveling, “for what purposes,” “from where to where,” “at what times,” and “by what modes of transportation.”
3. The Power of GIS to Accelerate Tourism Strategies
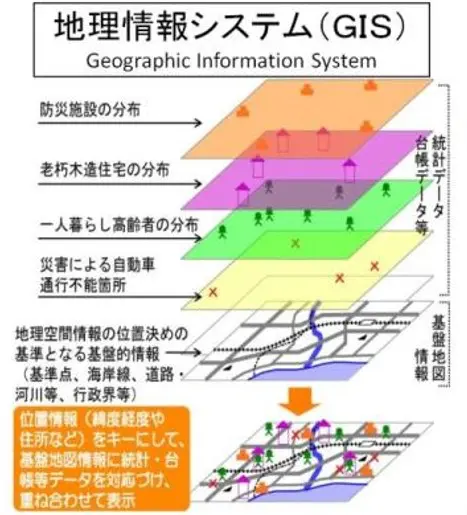
GIS is a system that layers various types of data with location information on a digital map, enabling analysis and visual display based on that location information. With GIS, tourist facilities, railway lines, administrative districts, and the like can be represented as points, lines, and areas, and given attribute information such as the number of users or population, which can then be combined for analysis. In Japan, based on the Basic Act on the Advancement of Utilizing Geospatial Information, enacted in 2007, various efforts have been made toward realizing a "2Geospatial Information Society (G-spatial Society)," in which anyone can use geospatial information and obtain accurate information based on advanced analysis. As part of this, geospatial information is increasingly being made available as open data, and GIS is being used as a tool for handling geospatial information in various fields such as disaster prevention, drones, and autonomous driving. In recent years, GIS also played a major role as a tool for visualizing human flow during the COVID-19 pandemic.
Tourism is made possible by the existence of destinations—"places"—and by people "moving" to them, and GIS excels at displaying and analyzing this kind of information about "places" and "movement." For example, souvenir shops, accommodations, stations, and bus stops can be expressed as point data; roads, railway lines, and bus routes as line data; and administrative districts, theme parks, national parks, and lakes as area data. These data are linked to attribute information such as business hours, number of users, facility names, and facility categories, making it possible to conduct analysis that combines location information with attribute information. In addition, factors such as population distribution within a certain area, the aging rate, and the total capacity of accommodations can be expressed as mesh data, which divides an area into squares at fixed intervals.
Figure 1: Conceptual Image of GIS
For example, even if human flow data reveals that "there is a lot of movement from Point A to Point B," it does not tell us why people choose that route or what lies along it. However, by using GIS to layer information such as tourist facilities, restaurants, transportation, and even scenic information along that route, we can gain clues to understand visitors' reasons for their choices and their potential needs. Similarly, even if human flow data reveals that a particular tourist destination has few visitors, it cannot determine the specific reason—whether it is "because access is poor," "because there are few attractive facilities," or "simply because information is not reaching people." However, by combining human flow data with transportation infrastructure, tourist facility data, and social media review data on GIS, we can gain clues for inferring the combined factors at play, which can be useful in considering improvement measures.
In this way, by using GIS to layer human flow data with other data, it becomes possible to conduct multifaceted analysis of regional characteristics and challenges that could not be understood through human flow data alone, or through the statistical data and questionnaire surveys previously expressed in tables and graphs—and to grasp the results intuitively on a map.
2 Geospatial information is a general term for data that includes location and various related details. In addition to human flow data, there are various types, such as map data (e.g., topographic maps and land-use maps), aerial photograph data from satellites and aircraft, various observation data, cadastral data on roads and rivers, and statistical data on population and agriculture.
4. Examples of Analyses Utilizing Human Flow Data and GIS
Our company has developed a proprietary system, 3"Japan Travel Bridge™," which visualizes and analyzes human flow data on a map. With Japan Travel Bridge™, you can visually analyze, on a map, where people from various countries—including foreign visitors—are traveling within any area in Japan. Here, let us look at what kinds of analysis are possible by layering various data onto the human flow data extracted from Japan Travel Bridge™. (The examples featured here were analyzed specifically for this article, and some include data that has been independently processed.)
3 Click here for details on Japan Travel Bridge™
Case 1: Considering Measures to Promote Dining Within the City Using Human Flow × Survey Results
In a certain region, a street survey was conducted targeting visitors to tourist spots within the city, asking about the time of their visit and where they ate lunch. The results revealed that, despite a high number of visitors around noon, there were spots—such as Tourist Facility F and Historical Tourist Spot G—where the proportion of people who ate lunch within the city was low compared to other surveyed spots (Figure 2). However, the survey results alone could not reveal the underlying causes.
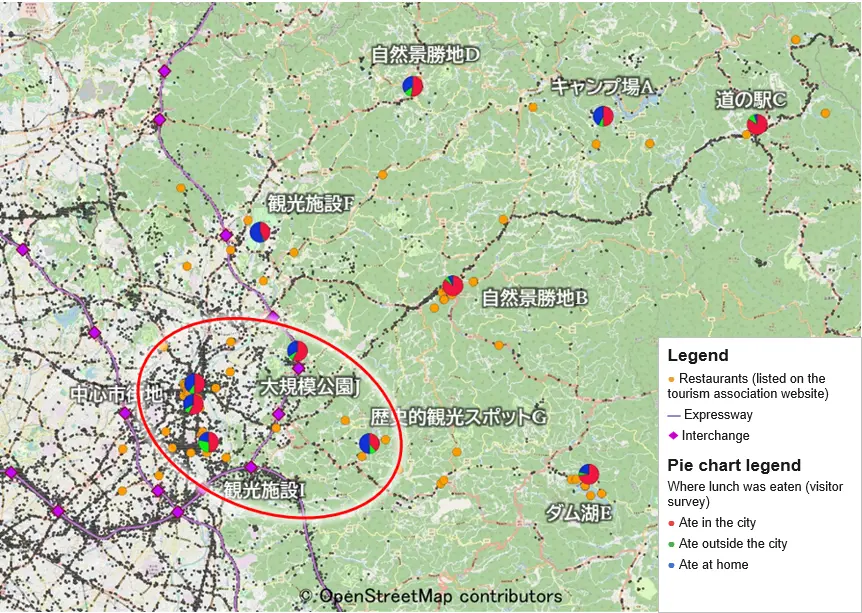
Therefore, we layered the human flow data of people who visited the city, the lunch-dining rate within the city at each survey point, and the restaurants within the city, resulting in Figure 3. From Figure 3, one possible factor is that Tourist Facility F and Historical Tourist Spot G—which have many visitors during lunch hours yet a low proportion of people eating lunch within the city—have relatively few restaurants nearby. It also became clear that, although a certain degree of human flow was observed between these spots and the city center or Scenic Natural Site B, where there are many restaurants, this does not necessarily translate into dining.
Based on this analysis, when considering future measures, it would be effective not only to strengthen efforts to attract visitors to tourist facilities, but also to combine approaches such as designing travel routes that link with the city center and Scenic Natural Site B, where restaurants are concentrated, as well as providing incentives to eat lunch within the city, such as coupons and stamp rallies.
Figure 2: Results of the Visitor Survey
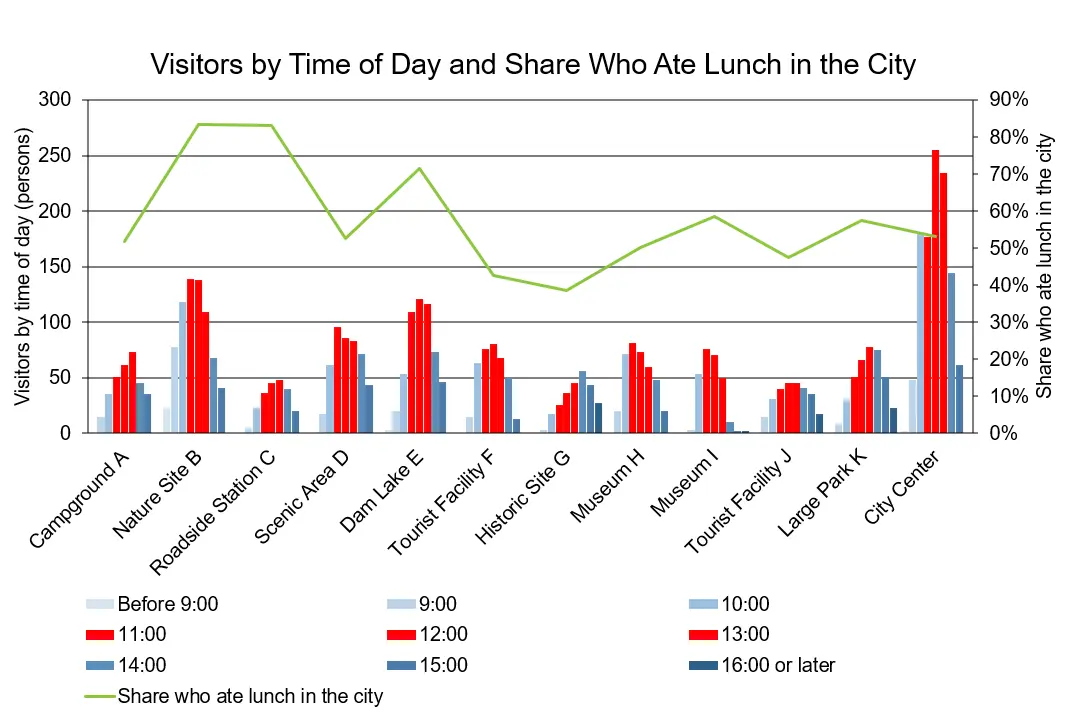
Figure 3: Human Flow Data Within the City, Survey Results, and Distribution of Restaurants
Case 2: Considering Tsunami Evacuation Measures for Foreign Tourists Using Human Flow × Elevation Data × Evacuation Shelter Data
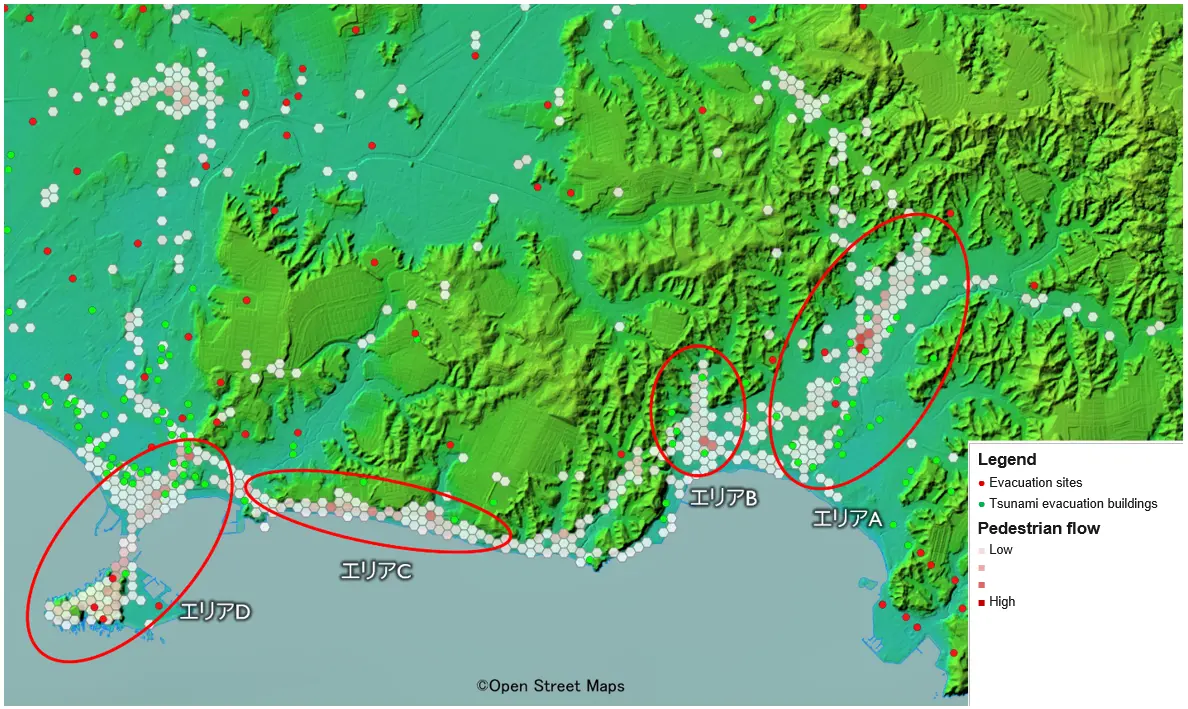
Figure 4 shows the result of layering the human flow data of foreign tourists from Asia with elevation data in a certain coastal tourist destination. The result revealed that tourists were concentrated in low-lying coastal areas that carry a high risk in the event of a tsunami. When evacuation shelters and tsunami evacuation buildings are layered onto this, it becomes clear that, even within this region, Area C in particular has relatively few evacuation destinations.
In such areas, evacuation may become difficult because evacuation distances are longer and the options for evacuation destinations are limited. Foreign tourists in particular tend to face challenges in obtaining and understanding evacuation information due to language barriers, in addition to being unfamiliar with the area, and can therefore be considered a group for which guidance systems in the event of a disaster should be given priority consideration. By combining these multiple types of information, it is possible to consider, for example, priority areas for installing evacuation guidance signs, or areas where evacuation guidance should be prioritized when a disaster strikes.
Figure 4: Analysis of Foreign Tourists' Stays Within the City and Distribution of Elevation and Evacuation Facilities
Case 3: Considering Regional Public Transportation Measures Using Popular Spots Extracted from Human Flow Data × Route Bus Routes
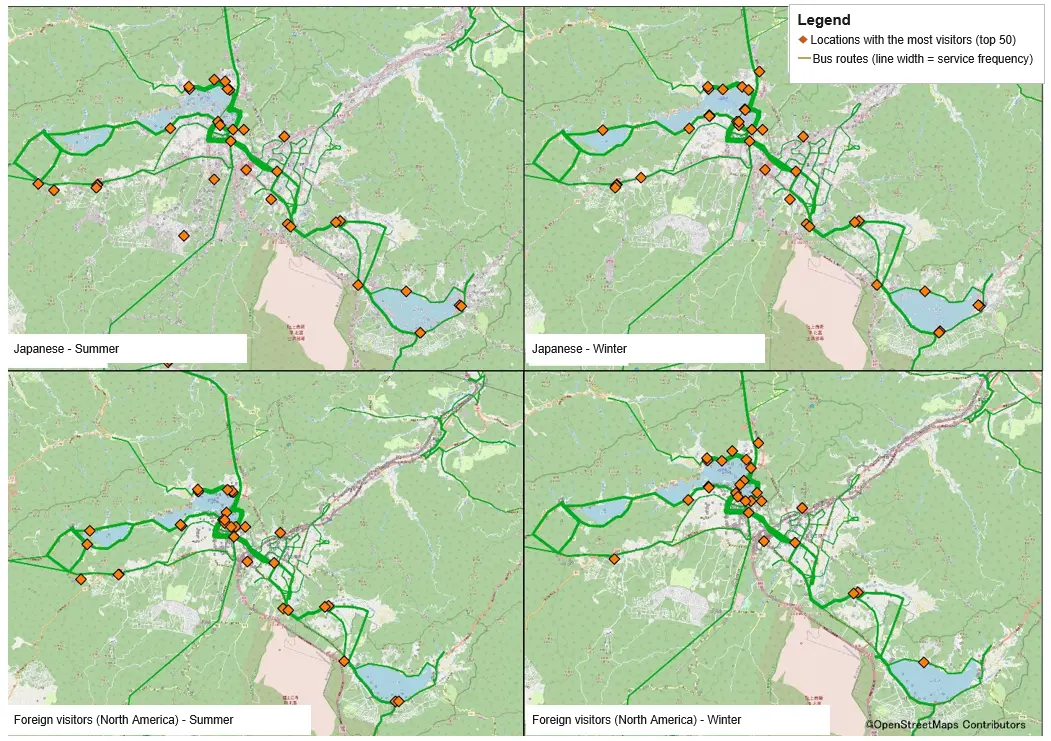
In a certain region that has become one of the major destinations for inbound foreign visitors, we analyzed the top 50 facilities by number of visitors—extracted based on the human flow data of Japanese tourists and foreign tourists from North America—by layering them with route bus operating routes (Figure 5).
The results showed that, in summer, destinations were relatively widely dispersed, and human flow—among both Japanese tourists and foreign tourists from North America—extended even to areas with low bus service frequency. In winter, on the other hand, it was confirmed that the number of people visiting areas with low bus service frequency decreased, particularly among foreign tourists from North America. In this region, because there is also snowfall in winter, tourists' dependence on route buses as a means of transportation is expected to increase. Based on these trends, tourist facilities in areas with low bus service frequency may be experiencing lost opportunities for winter visits due to limitations in transportation.
Going forward, if the goal is to disperse tourists' destinations across the region as a whole throughout the year, it will be necessary to consider, in the short term, revising operating routes and service hours, and in the medium to long term, securing means of transportation other than route buses.
Figure 5: Facilities with Many Visitors Extracted from Human Flow Data and Route Bus Routes
5. Conclusion —Challenges and Prospects for Promoting Data Utilization in the Tourism Field—
In this article, we have shown the potential to further enhance the value of human flow data by layering it with various types of information on a GIS, analyzing regional characteristics and challenges from multiple angles, and expressing the results in a way that is intuitive and easy to understand.
Human flow data and GIS are extremely powerful tools for conducting data-based analysis, but they are not magic tools that reveal every challenge a region faces or its solutions. To begin with, although human flow data is large-scale data, it is not collected from everyone visiting the region. It is important to note that, just like traditional questionnaire surveys, it is a sample survey based on data obtained from a portion of visitors rather than all of them. In addition, as mentioned at the outset, it is not easy to obtain qualitative information such as emotions and motivations from IoT devices. For these reasons, qualitative information obtained from traditional questionnaire surveys—and sometimes from the "on-the-ground intuition" of local tourism operators and residents—has by no means lost its importance.
In recent years, "EBPM (Evidence-Based Policy Making)" is increasingly being called for in the tourism field as well, and tools that make it easy to obtain and analyze diverse data—not limited to human flow data—have become widely available. What is required in such circumstances is not simply to collect data, but the ability to consider the meaning of obtaining that data, to form hypotheses from multiple datasets, and to connect them to the decision-making that a region needs. The value of human flow data lies not in the data itself, but is created only when it is combined with other information and connected to solving regional challenges. We hope that this article will serve as an opportunity for you, too, to consider "what kinds of data can be combined to lead to solving challenges" in your own region.
[Sources]
Tourism Toyota; Gourmet
National Land Numerical Information Download Site (Japanese)
List of Designated Emergency Evacuation Sites in Kanagawa Open Data Catalog (Japanese)
Kamakura City Disaster Prevention Information Map (Japanese)
Fujisawa City List of Tsunami Evacuation Buildings (Japanese)
Geospatial Information Authority of Japan Tiles; Color-Coded Elevation Map
(Marine areas created using data from the Japan Coast Guard’s Ocean Information Department)
Fujikyu Bus Open Data
著者